انضم إلى تحدي PU Xtrader اليوم
تداول برأس المال المحاكي واحصل على أرباح حقيقية بعد اجتياز برنامج تقييم المتداول الخاص بنا.
انضم إلى تحدي PU Xtrader اليوم
تداول برأس المال المحاكي واحصل على أرباح حقيقية بعد اجتياز برنامج تقييم المتداول الخاص بنا.
31 May 2023,06:00
Daily Market Analysis
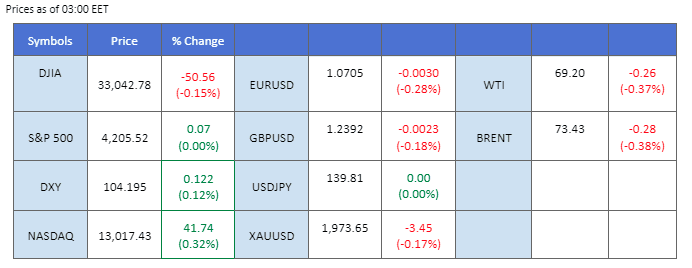
The bill regarding the U.S. debt limit has successfully cleared its first obstacle at the House Rules Committee, but it now faces another challenge in Congress. Ahead of the bill’s debate in the House, members from both political parties are engaging in dramatic discourse as some express opposition to the bipartisan agreement. This has led to a slight decline in the dollar’s value, while gold prices have rebounded due to heightened uncertainty surrounding the bill. Conversely, oil prices are being hindered by the headwinds of an economic downturn and are currently experiencing a bearish trend. Furthermore, the latest Chinese Purchasing Managers’ Index (PMI) for May has revealed further signs of weakening, impeding the recovery of oil prices. Investors are closely monitoring the outcome of the upcoming OPEC+ meeting scheduled for the weekend.
Current rate hike bets on 14th June Fed interest rate decision:
Source: CME Fedwatch Tool
0 bps (38%) VS 25 bps (62%)

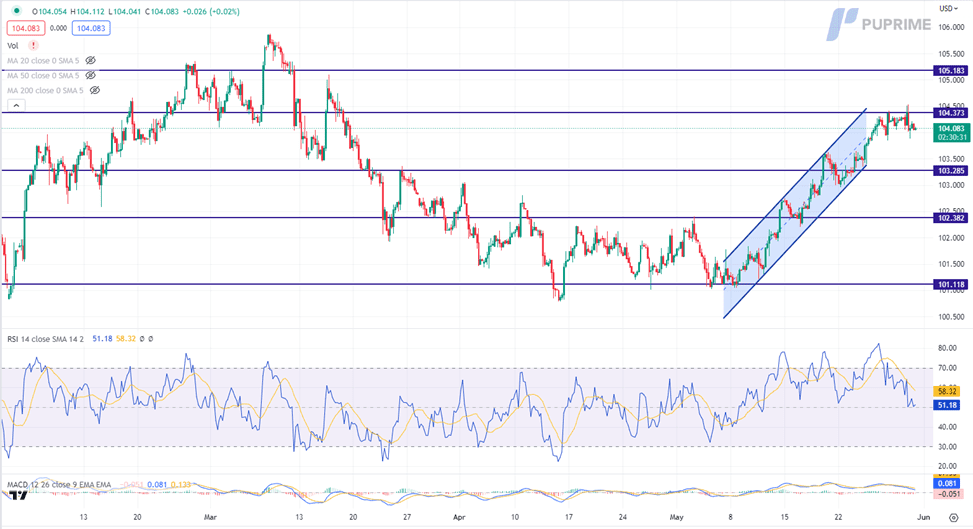
The US Dollar has experienced a significant retreat in recent days, largely driven by escalating tensions surrounding the ongoing debt ceiling talks. The uncertainty and disagreement among hard-right Republicans in the House have added fuel to the fire, as they oppose a bipartisan deal aimed at raising the government debt ceiling and setting federal funding limits. This division within the Republican party has created an atmosphere of doubt and scepticism, leading investors to lose confidence in the US Dollar.
The Dollar Index is trading lower following the prior retracement from the resistance level. MACD has illustrated increasing bearish momentum, while RSI is at 51, suggesting the index might extend its losses since the RSI retreated sharply from overbought territory.
Resistance level: 104.40, 105.20
Support level: 103.30, 102.40

In contrast to the retreat of the US Dollar, the price of gold has witnessed a notable surge. Gold is traditionally seen as a safe-haven asset during times of economic uncertainty and market volatility. The escalating tensions and uncertainties surrounding the debt ceiling talks have fuelled investors’ concerns, prompting them to seek refuge in the perceived stability of gold. The surge in gold prices reflects the apprehension and risk aversion prevailing in the market due to the ongoing political impasse.
Gold prices are trading higher following the prior breakout above the resistance level. MACD has illustrated increasing bullish momentum, while RSI is at 54, suggesting the commodity might extend its gains toward resistance level.
Resistance level: 1980.00, 2005.00
Support level: 1950.00, 1915.00
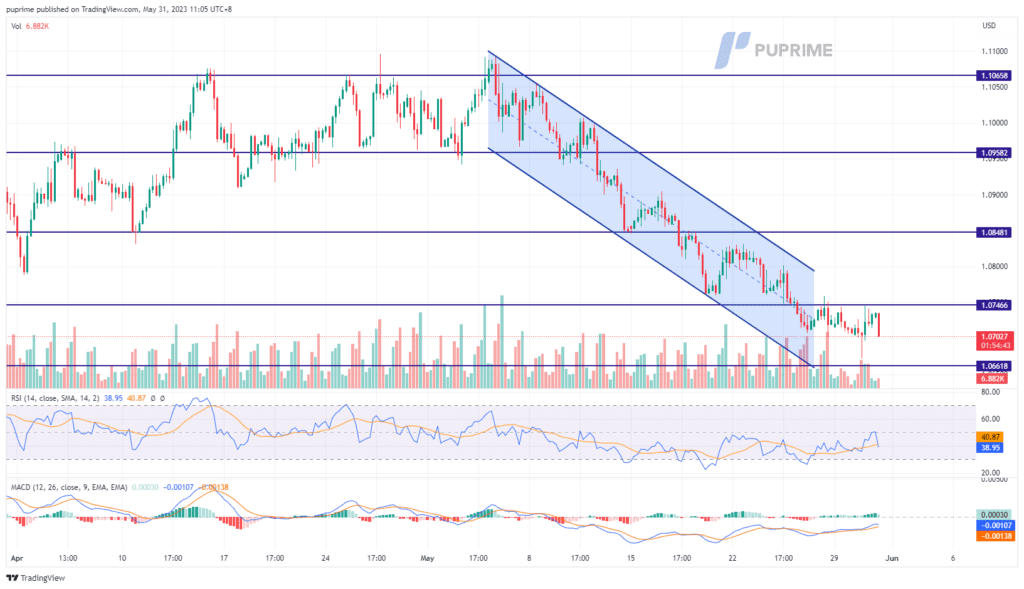
The EUR/USD has eased from its bearish momentum since the start of May due to sideways dollar trading before the Congress vote on the debt-limit bill. The dollar was suppressed at near $104.4 when the time was ticking toward the x-date as the U.S. had a high chance of defaulting on its bill by then. On the other hand, the member states in the eurozone show signs of easing in its inflation and may further weaken the euro. The eurozone CPI will be released tomorrow, a sign of easing in the economy’s inflation may put pressure on the euro to trade against the strengthened dollar.
The euro is trading in its downtrend channel while it has signs of easing from its current bearish momentum. However, the RSI is still hovering below 50-level suggesting a low buying power, while the MACD has signs of rebound and flows toward the zero line perhaps implying a trend reversal.
Resistance level: 1.0746, 1.0848
Support level: 1.0662, 1.0612
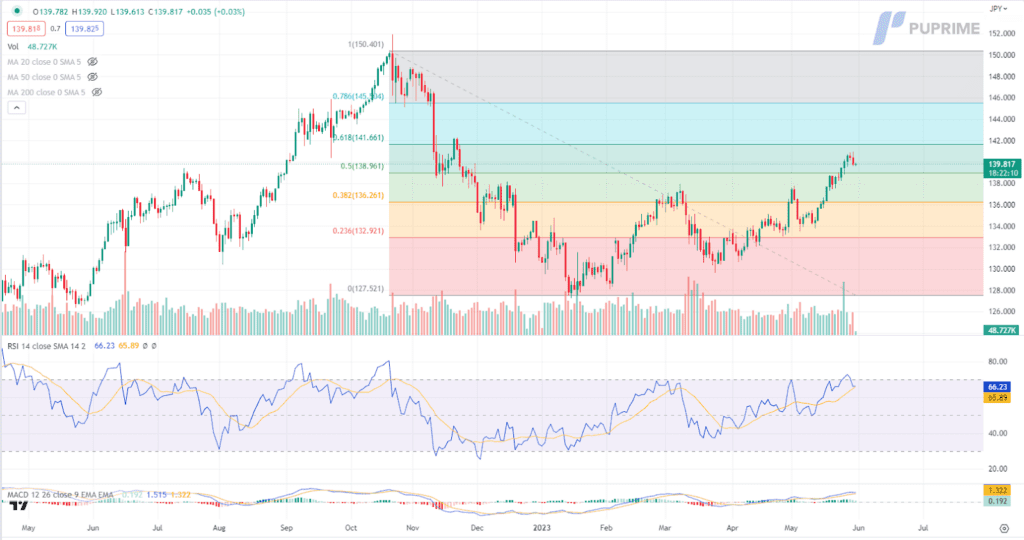
The Japanese yen surged following statements from Japan’s top FX diplomat, who emphasised the country’s commitment to closely monitor currency movements and ensure stability. The diplomat stated that they would carefully observe the currency market and take appropriate actions when necessary. In response to a question about the possibility of currency intervention, the diplomat asserted that they would not rule out any available options. These statements indicate Japan’s willingness to take measures to protect the yen’s stability and potentially intervene in the currency market if deemed necessary.
USD/JPY is trading lower while currently nearby the support level. MACD has illustrated diminishing bullish momentum, while RSI is a 66, suggesting the pair might enter overbought territory.
Resistance level: 141.65, 145.50
Support level: 138.95, 136.25
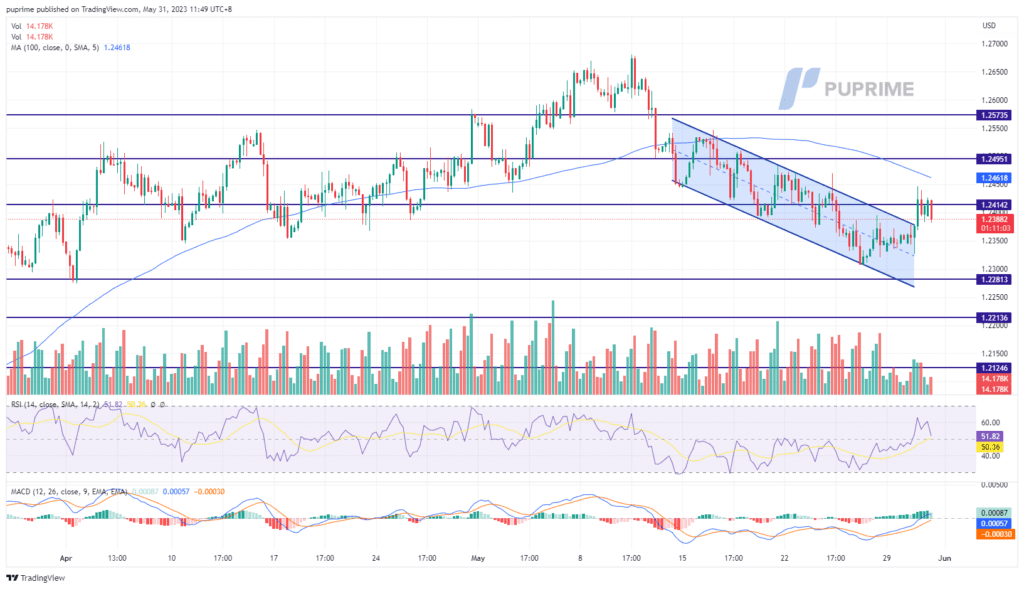
The cable has broken above its short-term downtrend channel and has traded above 1.2400. The dollar index retreated after it touched 104.5 before the debt-limit bill was passed in congress. In the U.K. the inflation has signs of persistence which backs the idea of more interest rate hikes from the BoE. The U.K. manufacturing PMI is set to release on Thursday ( 1st June); a higher reading from the forecasted number will bolster the cable to trade higher.
Indicators show that the GBPUSD pair has a trend reversal with the RSI rebounding from the near oversold zone to above 50-level and the MACD has crossed above the zero line.
Resistance level: 1.2495, 1.2574
Support level: 1.2281, 1.2214
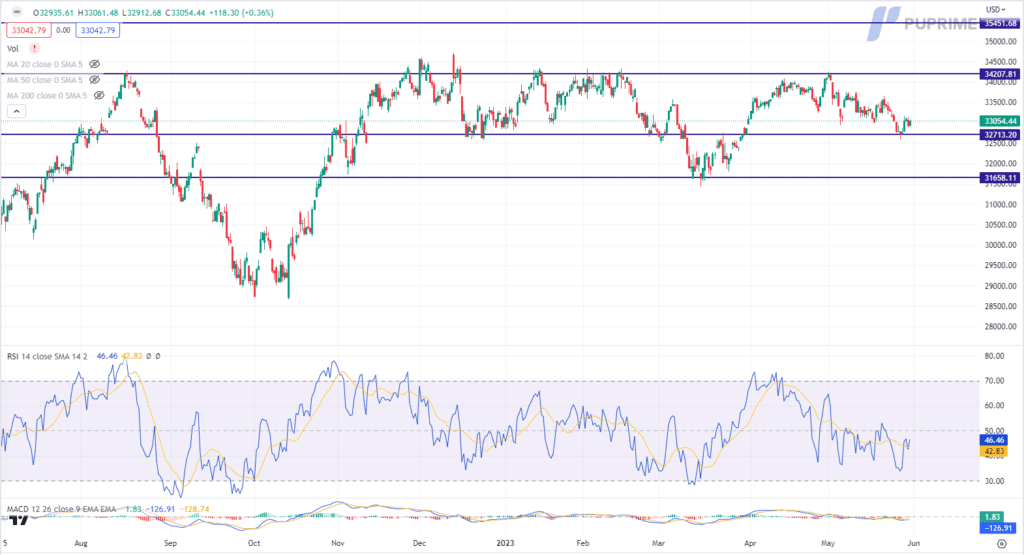
Rising tensions surrounding the debt ceiling have continued to weigh on the US equity market, The Dow continues to hover near the support zone. The fate of the debt ceiling bill remains uncertain, as conservative Republicans, led by Representative Chip Roy, express reservations, and vow to fight against certain provisions. Speaker Kevin McCarthy remains optimistic about the bill’s chances of passing, but time is running out, as approval from both the House and Senate is required by Monday to avert a default. This ongoing uncertainty has heightened investor concerns, contributing to market volatility and persistently bearish sentiment.
The Dow is trading lower while currently testing the support level. However, MACD has illustrated diminishing bearish momentum, while RSI is at 46, suggesting the index might experience technical correction since the RSI rebounded sharply from oversold territory.
Resistance level: 34210, 35450
Support level: 32715, 31660

The drama surrounding the US debt ceiling, subdued Memorial Day fuel demand, and conflicting signals from key oil-producing nations have contributed to the significant tumble in oil prices. The uncertainty and volatility in the market reflect investors’ cautious stance and their sensitivity to geopolitical factors and global economic conditions. The outcome of the debt ceiling negotiations and the upcoming OPEC+ meeting will play crucial roles in shaping the future trajectory of oil prices and investor sentiment in the energy market.
Crude oil prices are trading lower following the prior breakout below the previous support level. MACD has illustrated diminishing bearish momentum, while RSI is at 31, suggesting the commodity might enter oversold territory.
Resistance level: 71.00, 73.30
Support level: 67.95, 65.55

Trade with simulated capital and earn real profits after you pass our trader assessment.

12 December 2023, 05:38 All Eyes On U.S. CPI Reading

11 December 2023, 05:23 Dollar Surges On Exceptional Jobs Data

8 December 2023, 05:50 Yen Rallies On BoJ Hawkish Comment