انضم إلى تحدي PU Xtrader اليوم
تداول برأس المال المحاكي واحصل على أرباح حقيقية بعد اجتياز برنامج تقييم المتداول الخاص بنا.
انضم إلى تحدي PU Xtrader اليوم
تداول برأس المال المحاكي واحصل على أرباح حقيقية بعد اجتياز برنامج تقييم المتداول الخاص بنا.
29 September 2023,05:37
Daily Market Analysis
29 September 2023, 05:37
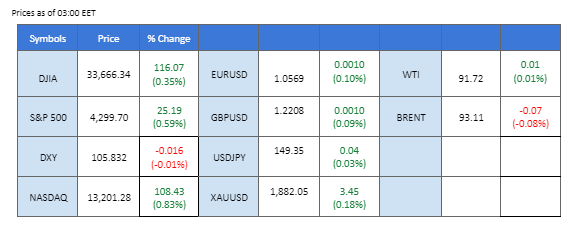
The U.S. dollar, which had reached its peak since December, experienced a decline following yesterday’s release of U.S. economic data that failed to meet projections. Disappointing figures in the U.S. GDP price index, falling short of both prior readings and market expectations, coupled with signs of deceleration in U.S. home sales, put downward pressure on the dollar, nullifying its gains from the previous day. Conversely, Australia saw a dip in retail sales data, causing the Aussie dollar to drop to its lowest point since last November. However, a robust recovery prior to the Reserve Bank of Australia’s upcoming interest rate decision, fueled by the possibility of the RBA continuing its monetary tightening cycle, added a layer of complexity to the currency market dynamics.
Current rate hike bets on 1st November Fed interest rate decision:
Source: CME Fedwatch Tool
0 bps (78.0%) VS 25 bps (22%)
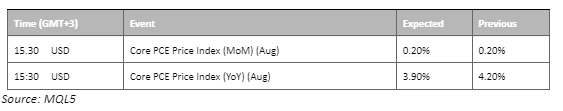
Despite rising US Treasury yields, the US Dollar retreated as investors seized the opportunity to book profits and reallocate their portfolios toward undervalued currencies. Nevertheless, the fundamentals underlying the Dollar remain robust, particularly in the wake of the solid jobs report. Investors’ focus now shifts to the eagerly awaited release of the PCE Price Index to gauge the inflation landscape in the United States.
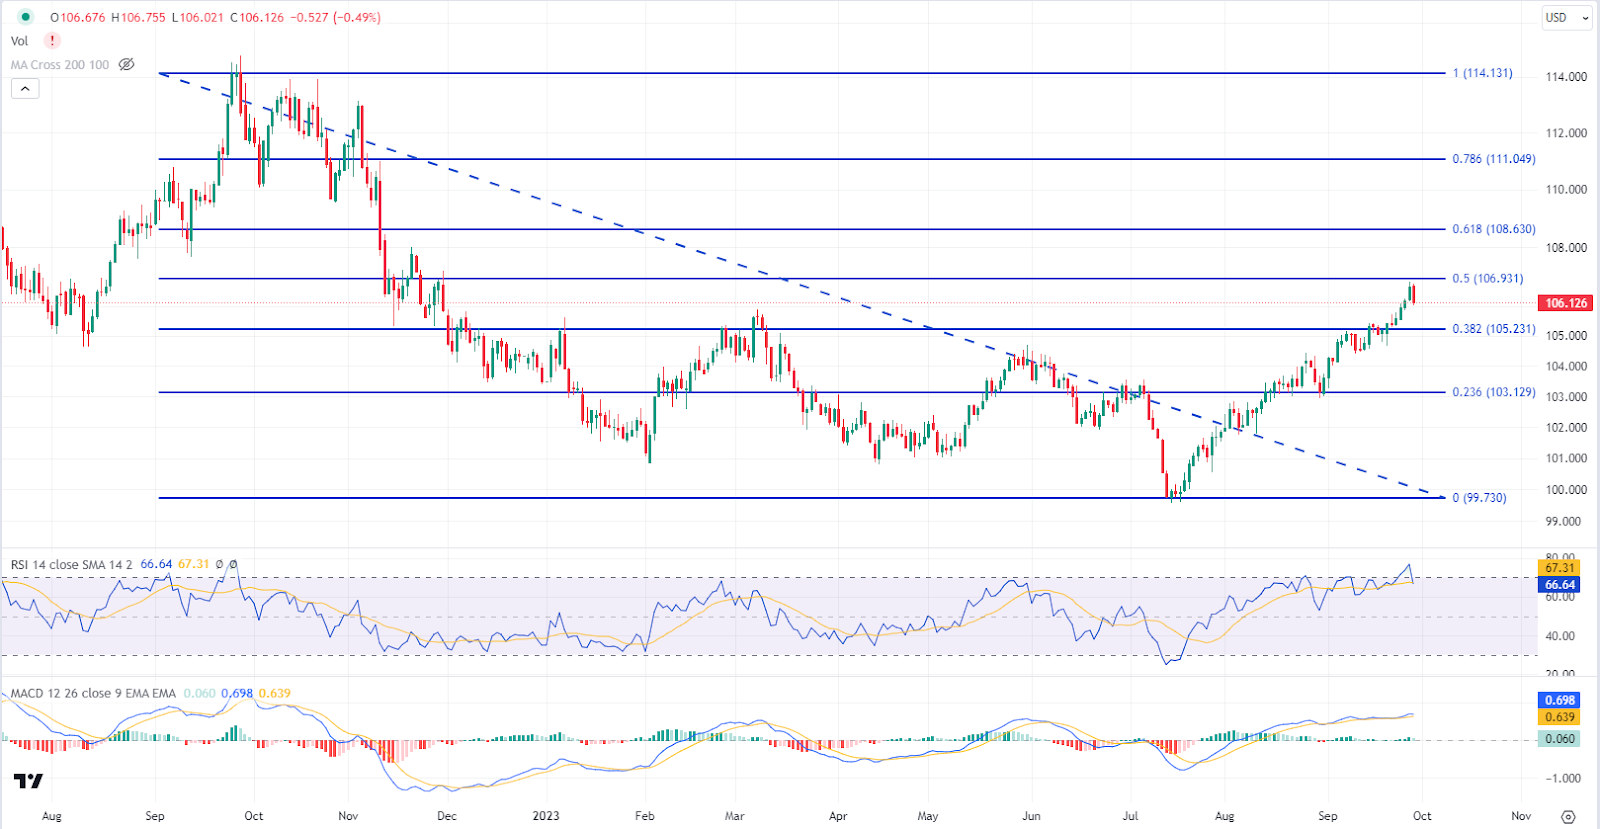
The Dollar Index is trading lower following the prior retracement from the resistance level. MACD has illustrated diminishing bullish momentum, while RSI is at 67, suggesting the index might enter overbought territory.
Resistance level: 106.95, 108.65
Support level: 105.25, 103.15
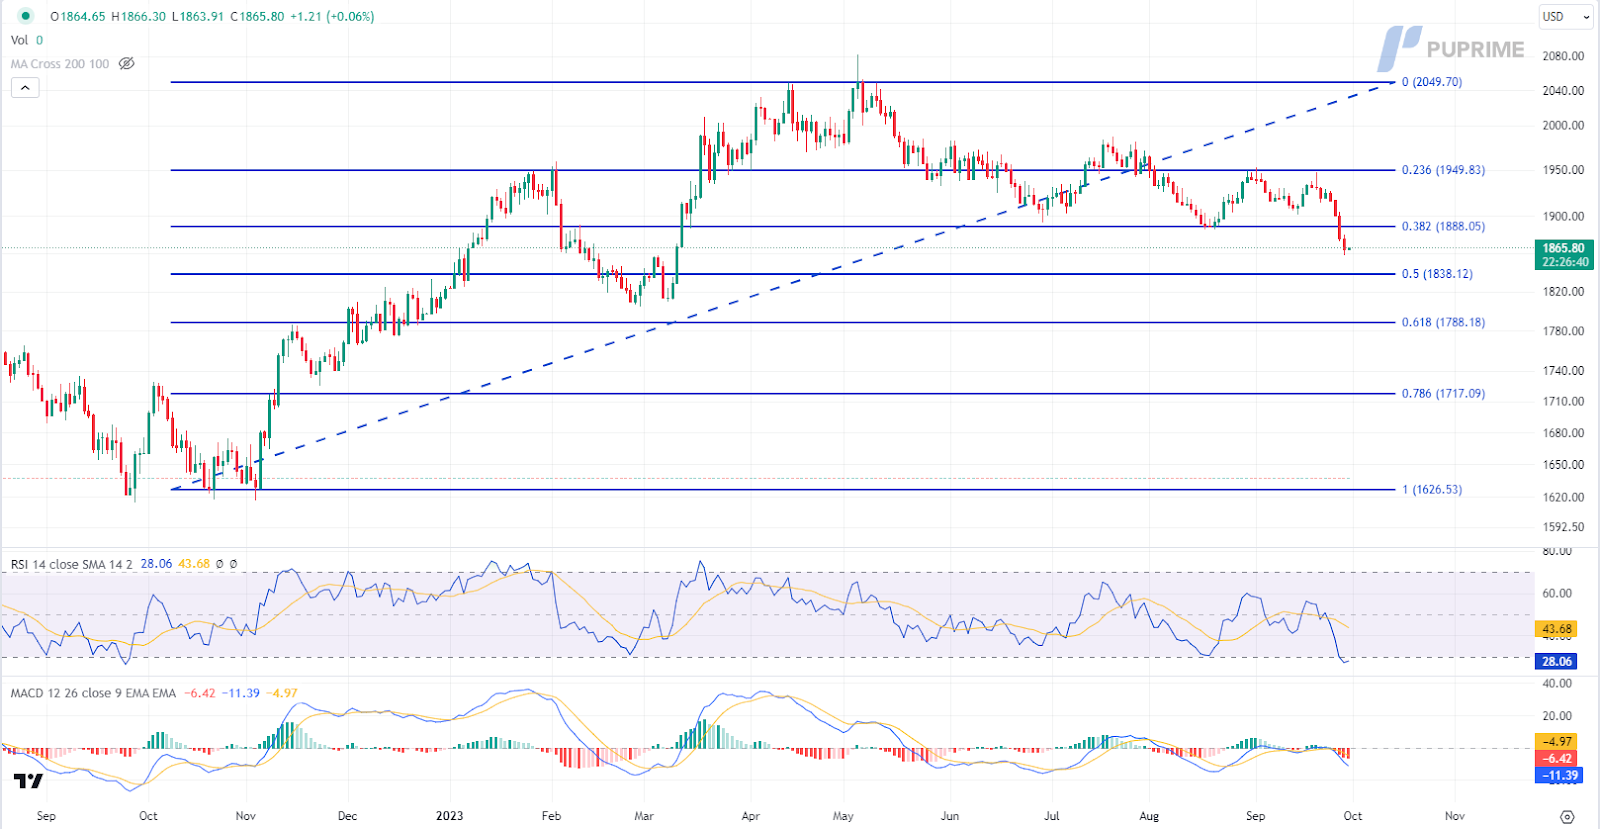
Gold prices have descended to levels not seen in seven months, primarily driven by the relentless rise in US Treasury yields and heightened expectations of rate hikes. Even as the US Dollar retreated from its November highs, the bond market selloff continued to exert downward pressure on non-yielding assets, including gold and silver.
Gold prices are trading lower following the prior breakout below the previous support level. However, MACD has illustrated diminishing bearish momentum, while RSI is at 28, suggesting the commodity might enter oversold territory.
Resistance level: 1890.00, 1950.00
Support level: 1840.00, 1790.00
Indications of potential easing in Eurozone inflation pushed the euro to its lowest point of the year against the USD, while the dollar maintained its robust performance. Both Spanish and German Consumer Price Indices (CPI) fell below market expectations, with the German CPI hitting its lowest level since May. These signs of economic softening across Eurozone member states restrained the euro’s ability to strengthen against the strong USD.
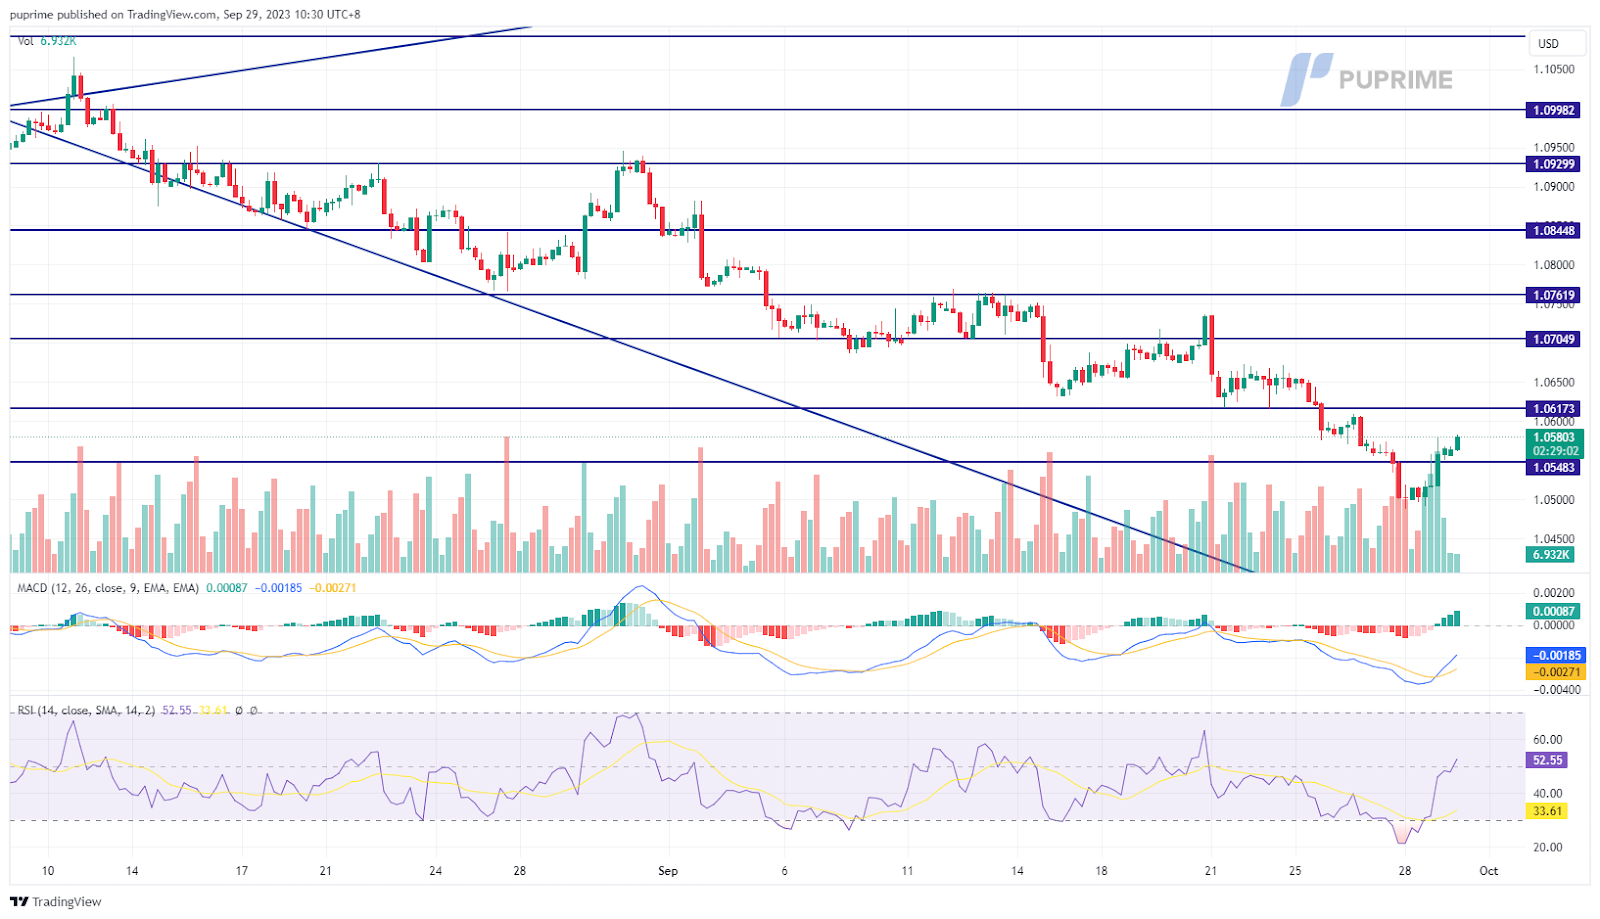
The Euro is able to defend against the strong USD at above 1.05000, a crucial psychological support level for the pair. The MACD has crossed while the RSI has rebounded strongly from the oversold zone suggesting the bearish momentum is diminishing.
Resistance level: 1.0617, 1.0705
Support level: 1.0548, 1.04730
The Pound Sterling rebounded from its earlier losses in anticipation of the pivotal UK GDP data set to be released later today. Weaker-than-anticipated U.S. economic indicators, including the GDP price index and New Home Sales, tempered the dollar’s strength, creating a favourable environment for the Sterling. Additionally, the alleviation of concerns regarding a U.S. government shutdown further softened the dollar’s position during the same period
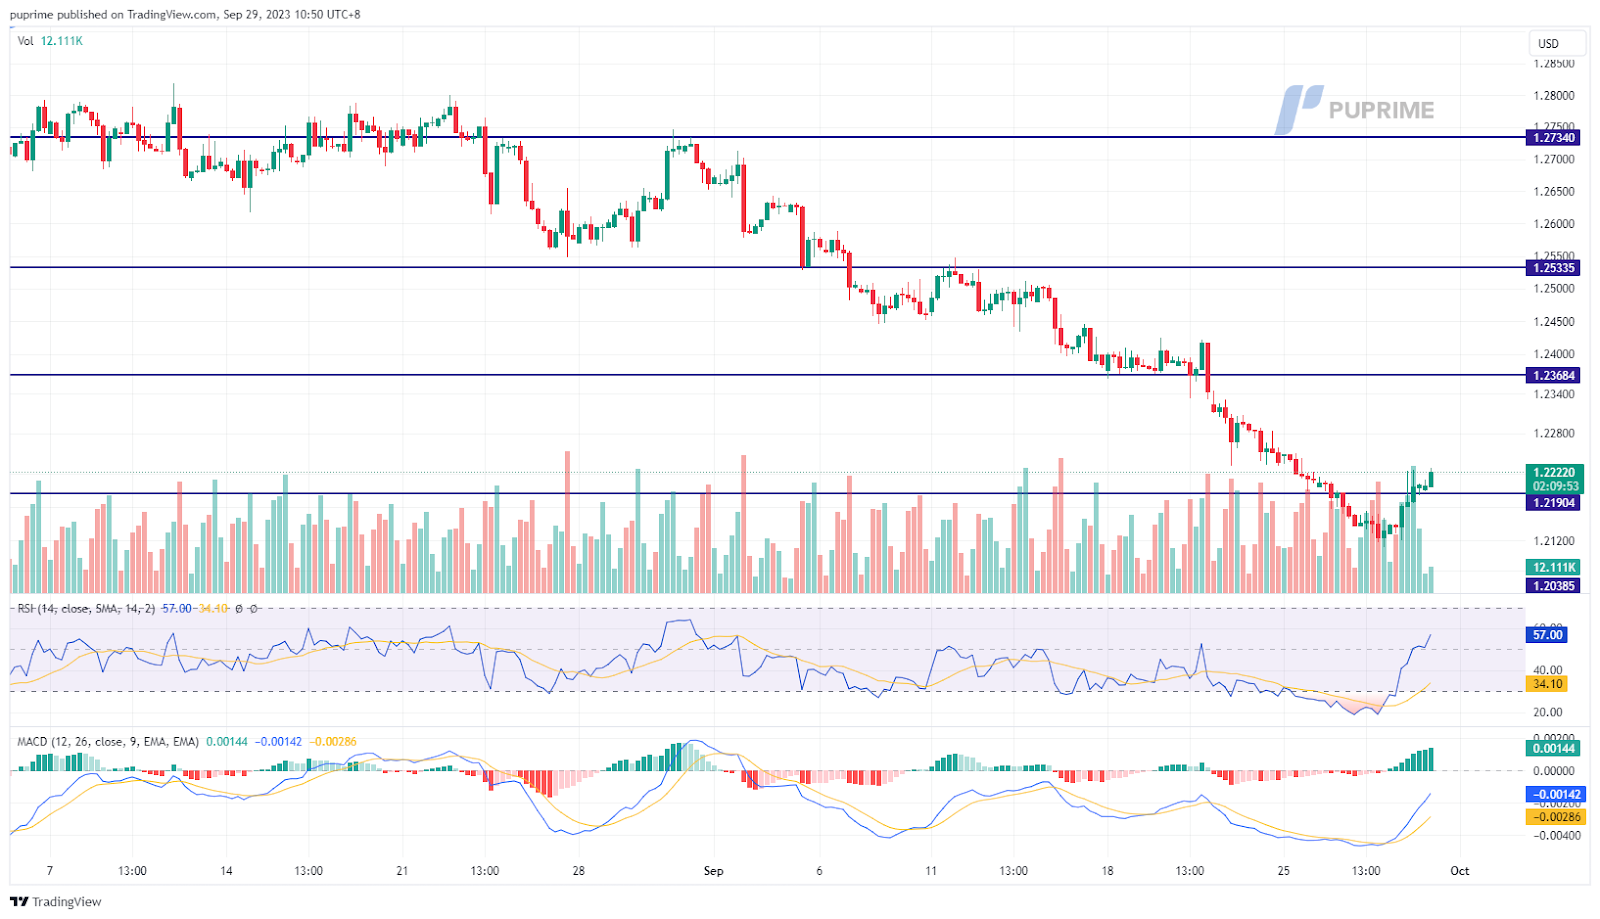
The Cable rebounded by more than 0.5% yesterday and has formed a solid bullish engulfing candlestick pattern, signalling for a trend reversal for the pair. The RSI has rebounded sharply from the oversold zone while the MACD has crossed and is approaching the zero line, echoing the trend reversal signal as well.
Resistance level: 1.2360, 1.2530
Support level: 1.2040, 1.1935
The Australian dollar (AUD) neared its annual low before staging a sharp recovery ahead of the impending RBA interest rate announcement scheduled for the upcoming Monday. Weaker-than-expected U.S. economic data and the easing of U.S. government shutdown concerns have subdued the dollar’s strength from its 2023 peak. Despite retail sales falling below market consensus, Australia’s monthly private sector credit saw a rise of 0.4%, leading the market to speculate that the RBA might resume its interest rate hikes after a three-month pause.
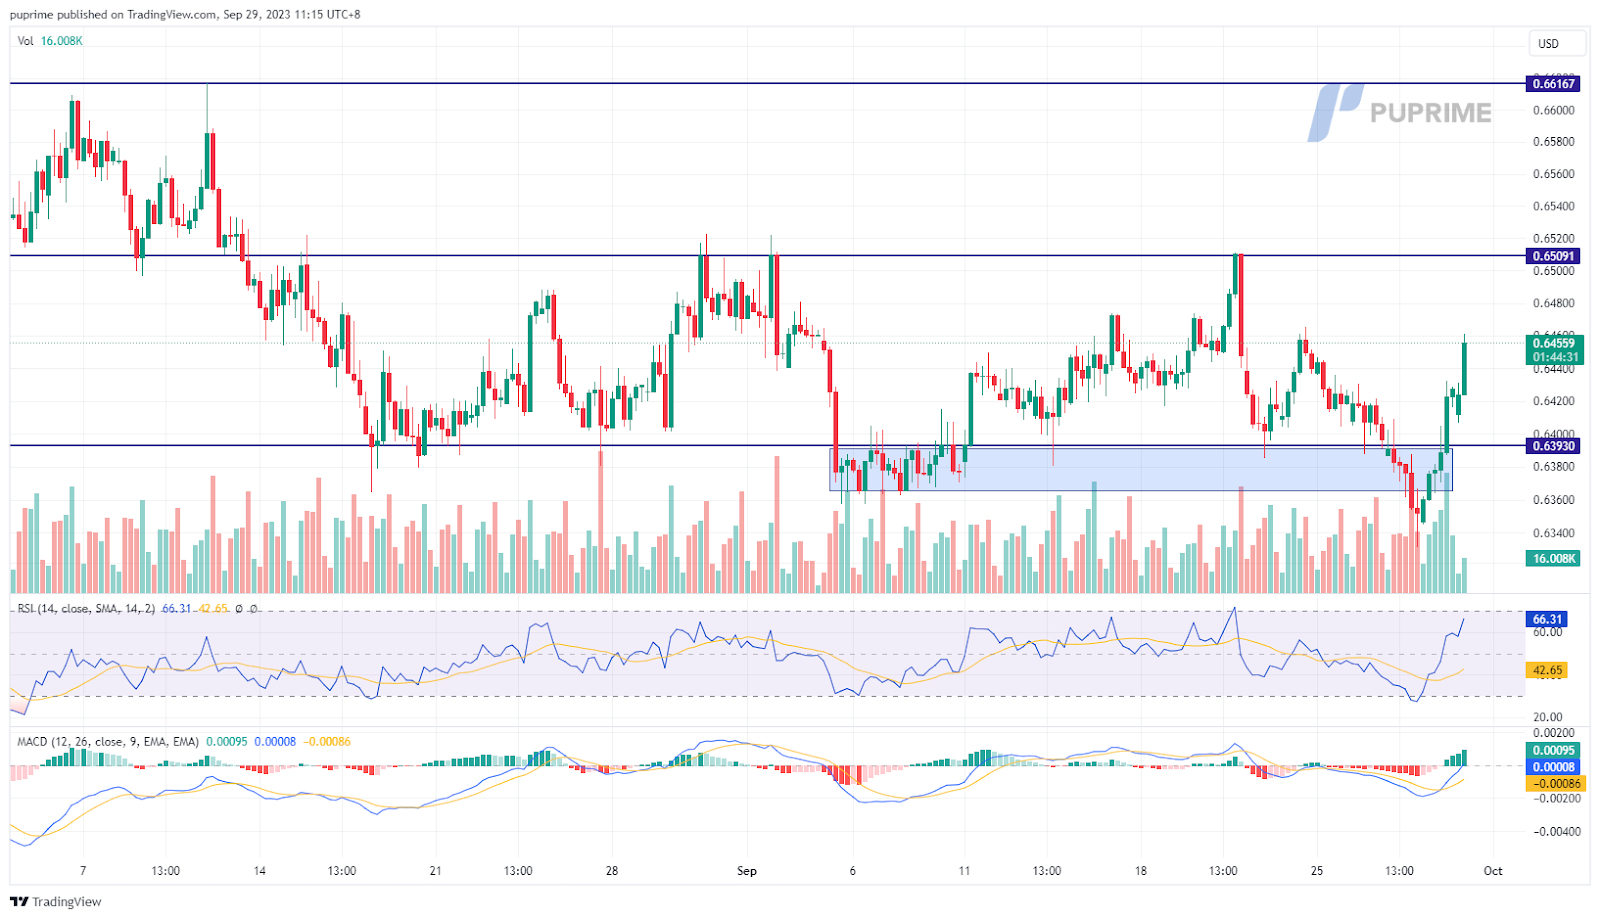
The AUD/USD has rebounded sharply from its lowest region of the year and the pair is currently trading in a broad sideways range. The RSI is approaching the overbought zone while the MACD is on the brink of breaking above the zero line, suggesting the bullish momentum has formed.
Resistance level: 0.6500, 0.6610
Support level: 0.6390, 0.6280
US equity markets rebounded after a recent downturn, as investors engaged in bargain buying. This resurgence in equities occurred despite the backdrop of surging Treasury yields, which had cast a shadow over stock markets. The recent ascent in yields, reaching levels not seen in 16 years, has dominated the investment landscape.
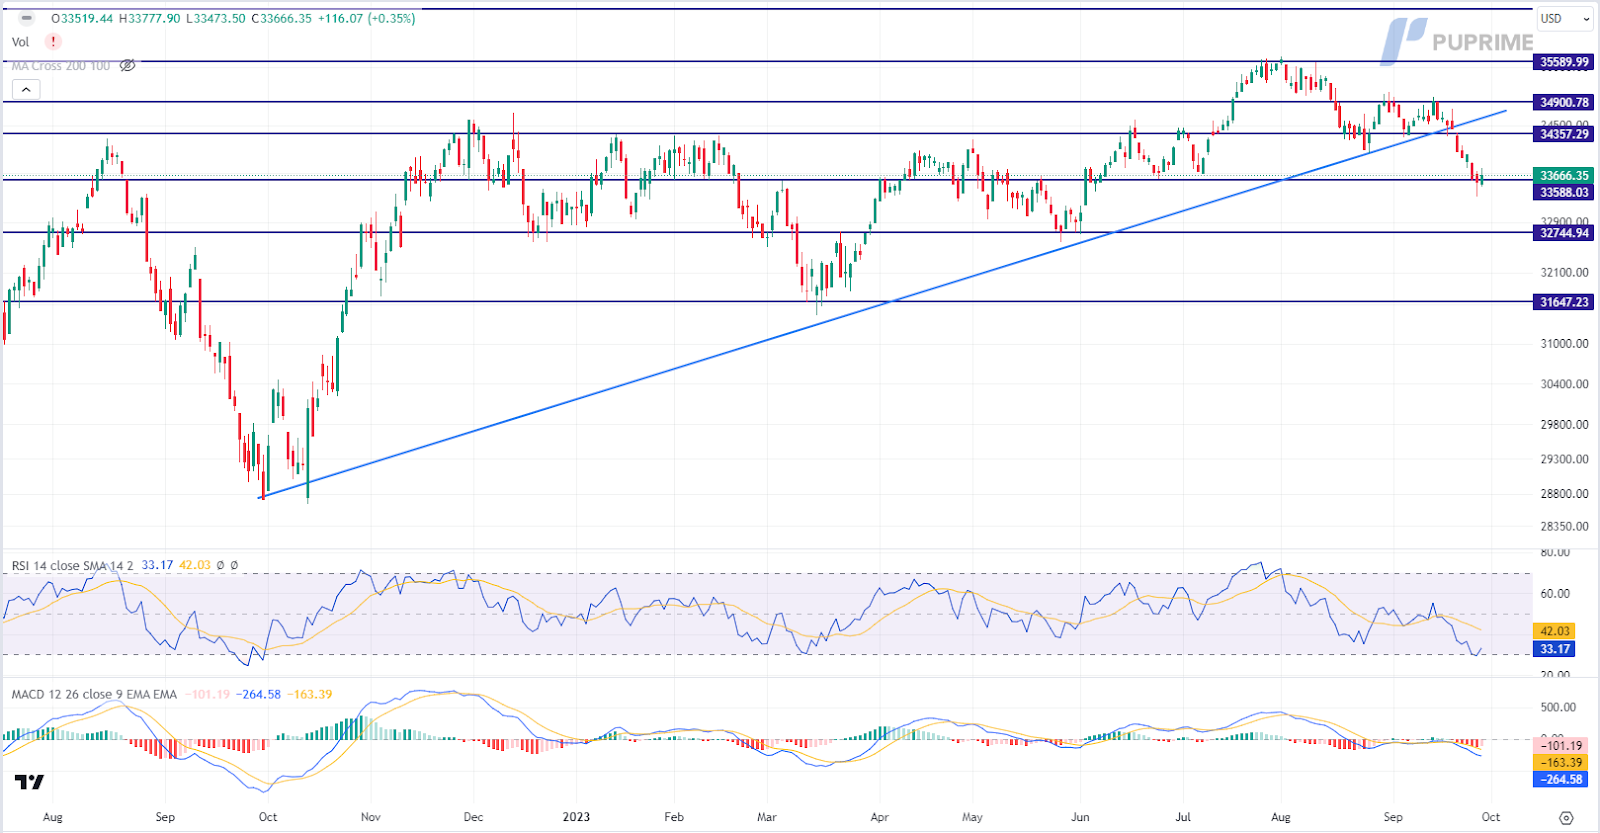
The Dow is trading lower while currently testing the support level. However, MACD has illustrated diminishing bearish momentum, while RSI is at 33, suggesting the index might enter oversold territory.
Resistance level: 34355.00, 34900.00
Support level: 33590.00, 32745.00

The Japanese yen experienced a mild rebound, with USD/JPY hovering around the critical 150 benchmark. Market sentiment suggests that the Bank of Japan may intervene if the yen crosses the 150 thresholds, prompting many traders to opt for profit-taking.
USD/JPY is trading lower following the prior retracement from the resistance level. MACD has illustrated increasing bearish momentum, while RSI is at 62, suggesting the pair might be traded lower since the RSI retraced from its overbought territory.
Resistance level: 150.25, 151.45
Support level: 148.50, 146.25

Despite strong fundamentals driven by aggressive oil production cuts by Saudi Arabia and Russia, the oil market witnessed a dip, with signs of potential overbought conditions. Investor caution prevails ahead of the release of the high-impact US PCE Price Index, which holds indirect implications for oil prices. Some investors chose to lock in profits to mitigate market volatility.
Oil prices are trading lower following the prior retracement from the resistance level. MACD has illustrated diminishing bullish momentum, while RSI is at 64, suggesting the commodity might enter overbought territory.
Resistance level: 94.40, 101.00
Support level: 87.80, 79.65

Trade with simulated capital and earn real profits after you pass our trader assessment.

12 December 2023, 05:38 All Eyes On U.S. CPI Reading

11 December 2023, 05:23 Dollar Surges On Exceptional Jobs Data

8 December 2023, 05:50 Yen Rallies On BoJ Hawkish Comment
Disclaimer: This website exclusively provides proprietary trading services. We do not engage in any regulated activities, offer investment management services, or manage funds on behalf of external clients. Our trading activities are conducted solely with the firm's own capital, and we do not accept client deposits or manage client accounts. It's important to note that none of the services we provide should be construed as investment or financial services in accordance with applicable laws.
This website offers services related to professional skill and experience assessment, which determine your eligibility to trade with the firm's capital. The outcome of these services is inherently determined by your individual skill level and ability to perform within the trading requirements and objectives outlined for each service separately. Clients are strongly advised to thoroughly understand the requirements of the services before signing up for any.
The content provided on this website is for informational purposes only and does not constitute financial, investment, or trading advice. The information presented is based on sources believed to be reliable, but we do not guarantee its accuracy, completeness, or timeliness. We disclaim any liability for any loss or damage arising directly or indirectly from the use of or reliance on the information provided on this website.
This website is not directed to residents of certain jurisdictions such as the United States, Singapore, Australia, China, Pakistan and some other specified regions, and is not intended for distribution to, or use by, any person in any countries or jurisdictions where such distribution or use would be contrary to local law or regulation.