انضم إلى تحدي PU Xtrader اليوم
تداول برأس المال المحاكي واحصل على أرباح حقيقية بعد اجتياز برنامج تقييم المتداول الخاص بنا.
انضم إلى تحدي PU Xtrader اليوم
تداول برأس المال المحاكي واحصل على أرباح حقيقية بعد اجتياز برنامج تقييم المتداول الخاص بنا.
7 November 2023,04:53
Daily Market Analysis
7 November 2023, 04:53
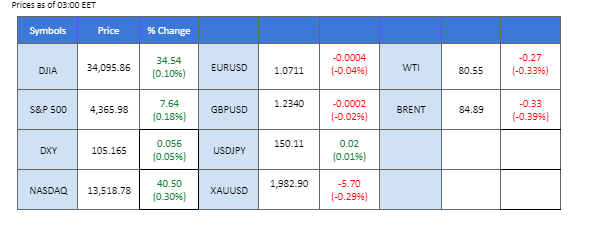
In a significant market shift, gold prices have witnessed a notable downturn as tensions in the Middle East show signs of abating. Israel’s decision to implement a ceasefire for humanitarian purposes, coupled with global leaders’ concerted efforts to mediate the conflict, has provided a semblance of stability. Contrastingly, oil prices have found support above the $80 mark, largely attributed to proactive measures by major oil-producing nations. Both Saudi Arabia and Russia have voluntarily curtailed oil supplies, aiming to bolster oil price stability amid geopolitical uncertainties. Investor focus has now shifted to China, where the keenly anticipated release of the Consumer Price Index (CPI) and Producer Price Index (PPI) holds sway. These indices are crucial barometers, offering insights into China’s economic resilience and its potential impact on global oil demand.
Current rate hike bets on 13rd December Fed interest rate decision:
Source: CME Fedwatch Tool
0 bps (98.0%) VS 25 bps (2%)
In the early hours of Asian trading, the US Dollar exhibited a modest rebound, primarily attributed to a technical correction. However, it’s crucial to note that the Dollar’s overall long-term outlook has tilted towards the negative spectrum. This shift is primarily driven by investors coming to terms with discouraging economic indicators from the United States, which, in turn, have given rise to dovish anticipations regarding the Federal Reserve’s policy stance. The lacklustre performance of last week’s Nonfarm Payroll report, coupled with a notable uptick in the Unemployment rate, has cast a shadow of uncertainty over the trajectory of the US economy.
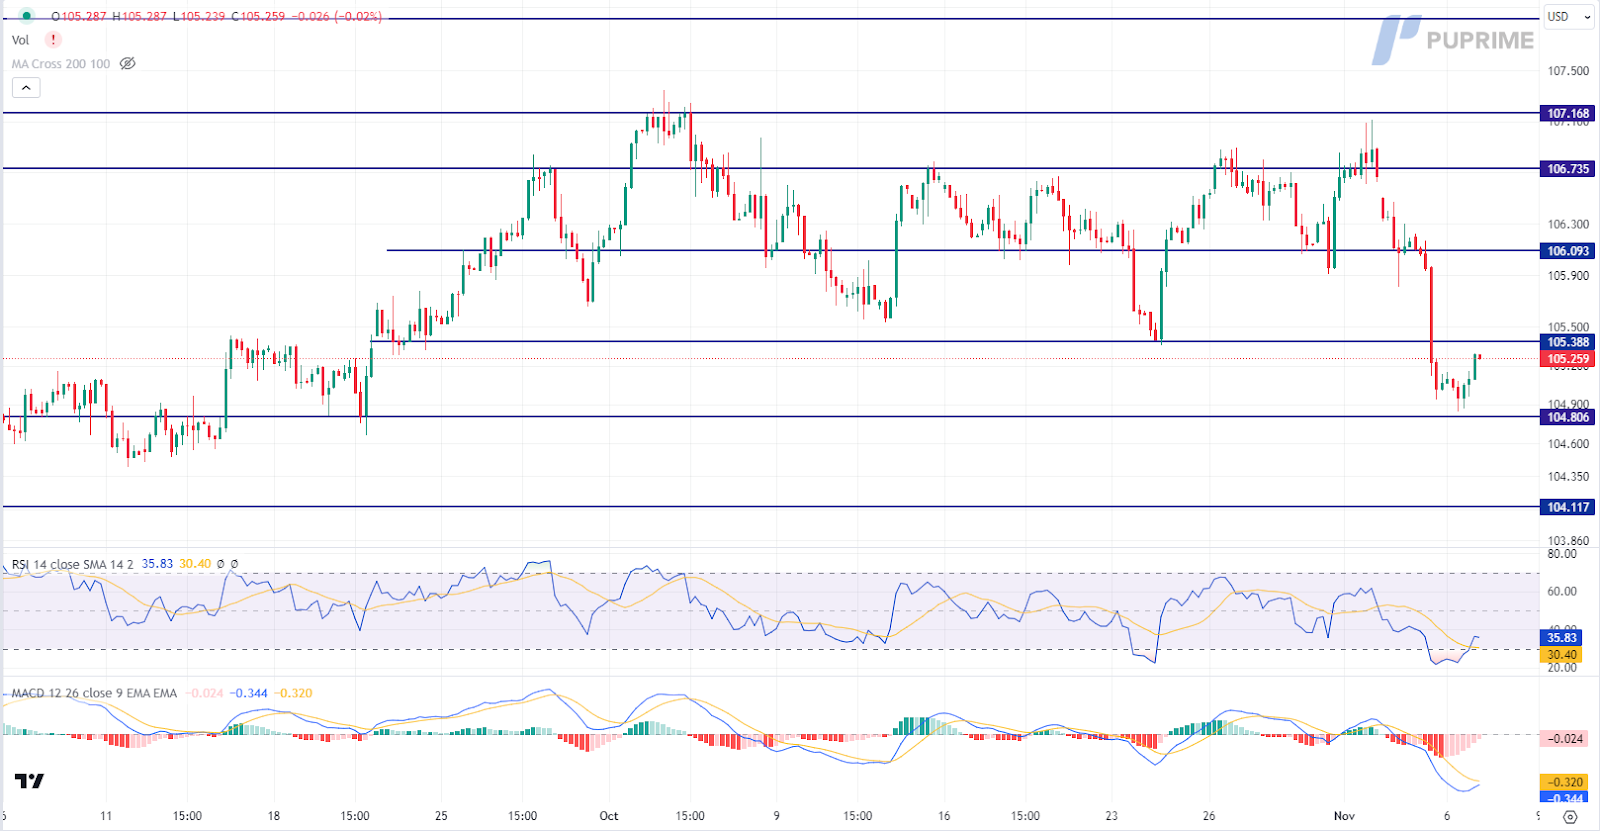
The Dollar Index is trading higher while currently near the resistance level. MACD has illustrated diminishing bearish momentum, while RSI is at 36, suggesting the index might extend its gains since the RSI rebounded sharply from oversold territory.
Resistance level: 105.40, 106.10
Support level: 104.80, 104.10
Gold prices have experienced a retreat, consolidating within a range defined by support and resistance levels, as conflicting fundamental factors leave investors seeking clearer market direction. Global efforts to ease tensions in the Middle East have reduced the appeal of gold as a safe-haven asset. However, the decline in gold’s value is somewhat offset by the weakening of the US Dollar, which has followed the retreat in US Treasury yields.
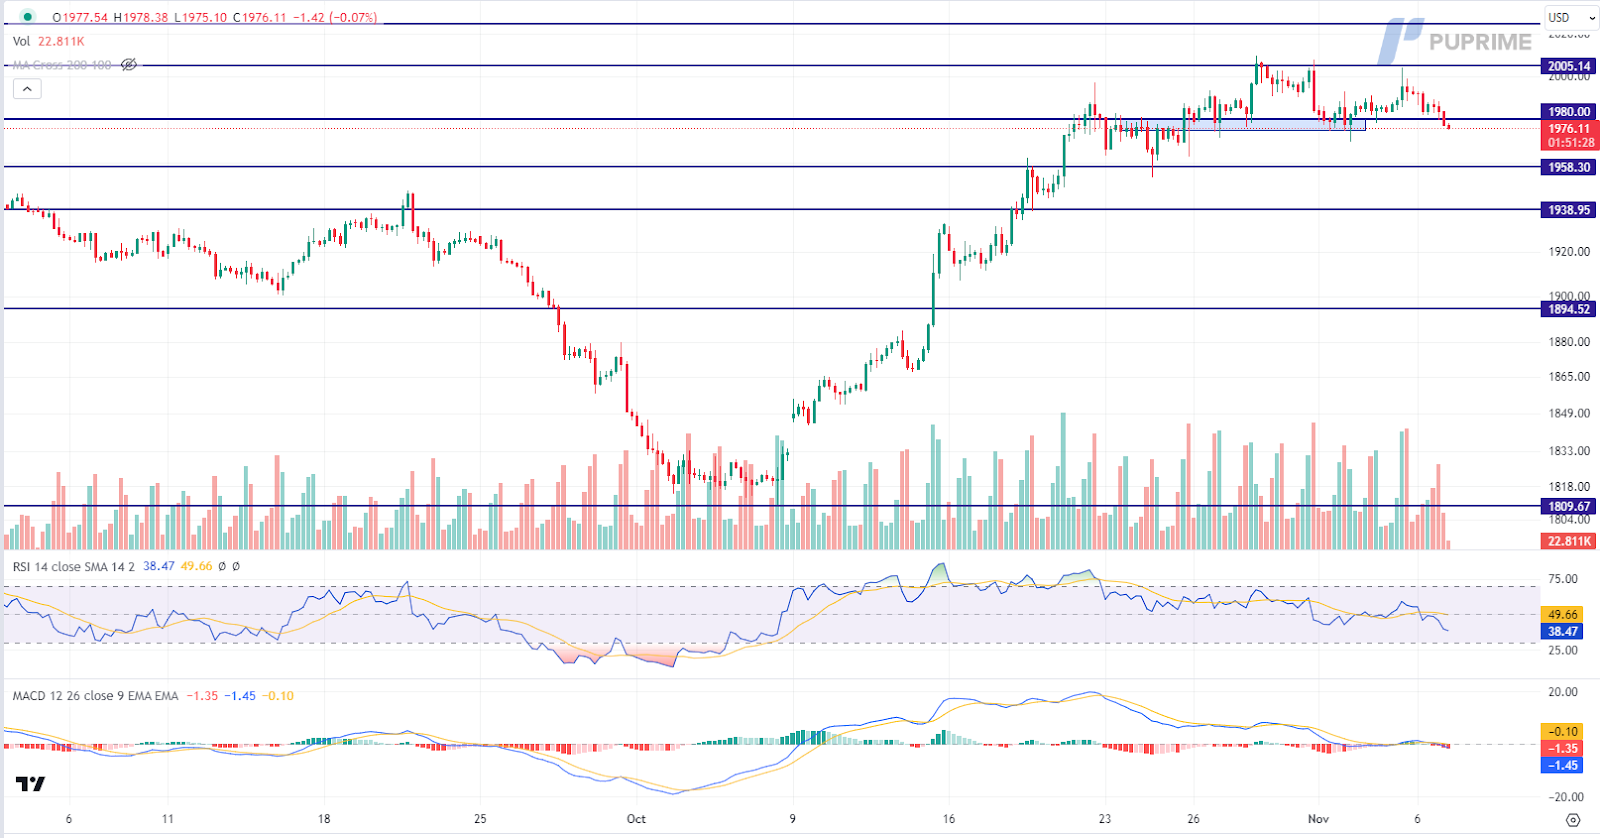
Gold is trading lower following the prior retracement from the resistance level. MACD has illustrated increasing bearish momentum, while RSI is at 38, suggesting the commodity might extend its losses since the RSI stays below the midline.
Resistance level: 1980.00, 2005.00
Support level: 1960.00, 1940.00
The Dollar index experienced a notable uptick, bolstered by resolute statements from Federal Reserve officials cautioning against excessive optimism, emphasising the ongoing battle against inflation. Market participants are eagerly anticipating Federal Reserve Chair Jerome Powell’s upcoming speech on Thursday, seeking valuable insights into the central bank’s monetary policy trajectory. Simultaneously, the Euro faces a pivotal moment, with Wednesday’s release of German Consumer Price Index (CPI) data poised to influence the currency’s strength.
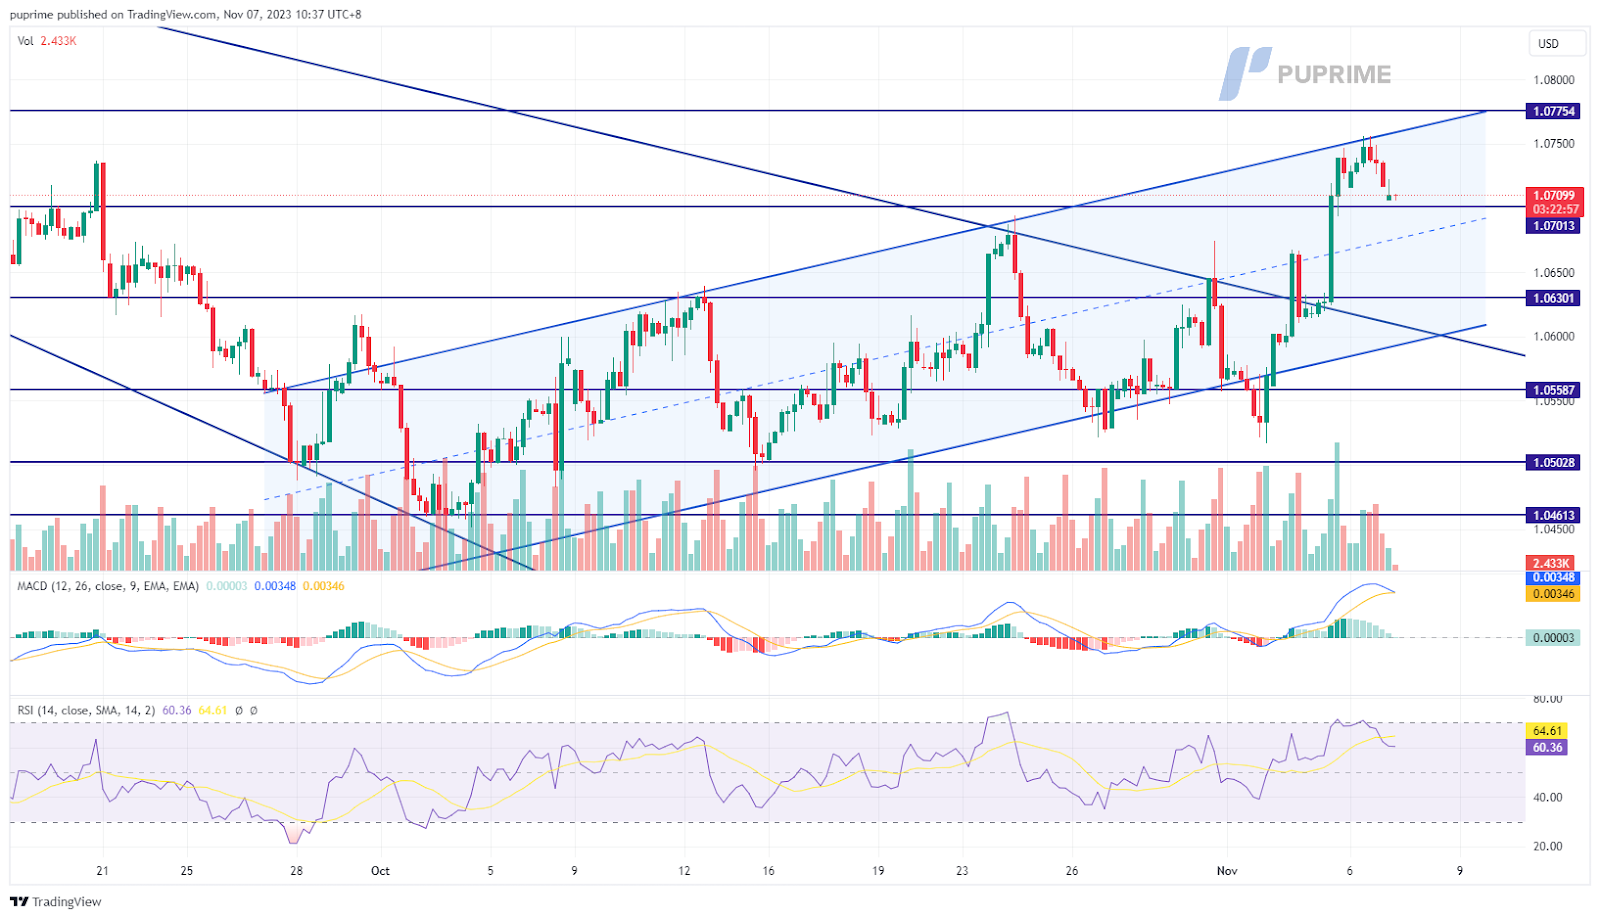
EUR/USD continues to trade within its uptrend channel and is suppressed by the resistance line. The RSI has eased from an upward trend, and the MACD has crossed, suggesting the bullish momentum has eased.
Resistance level: 1.0775, 1.0866
Support level: 1.0700, 1.0630
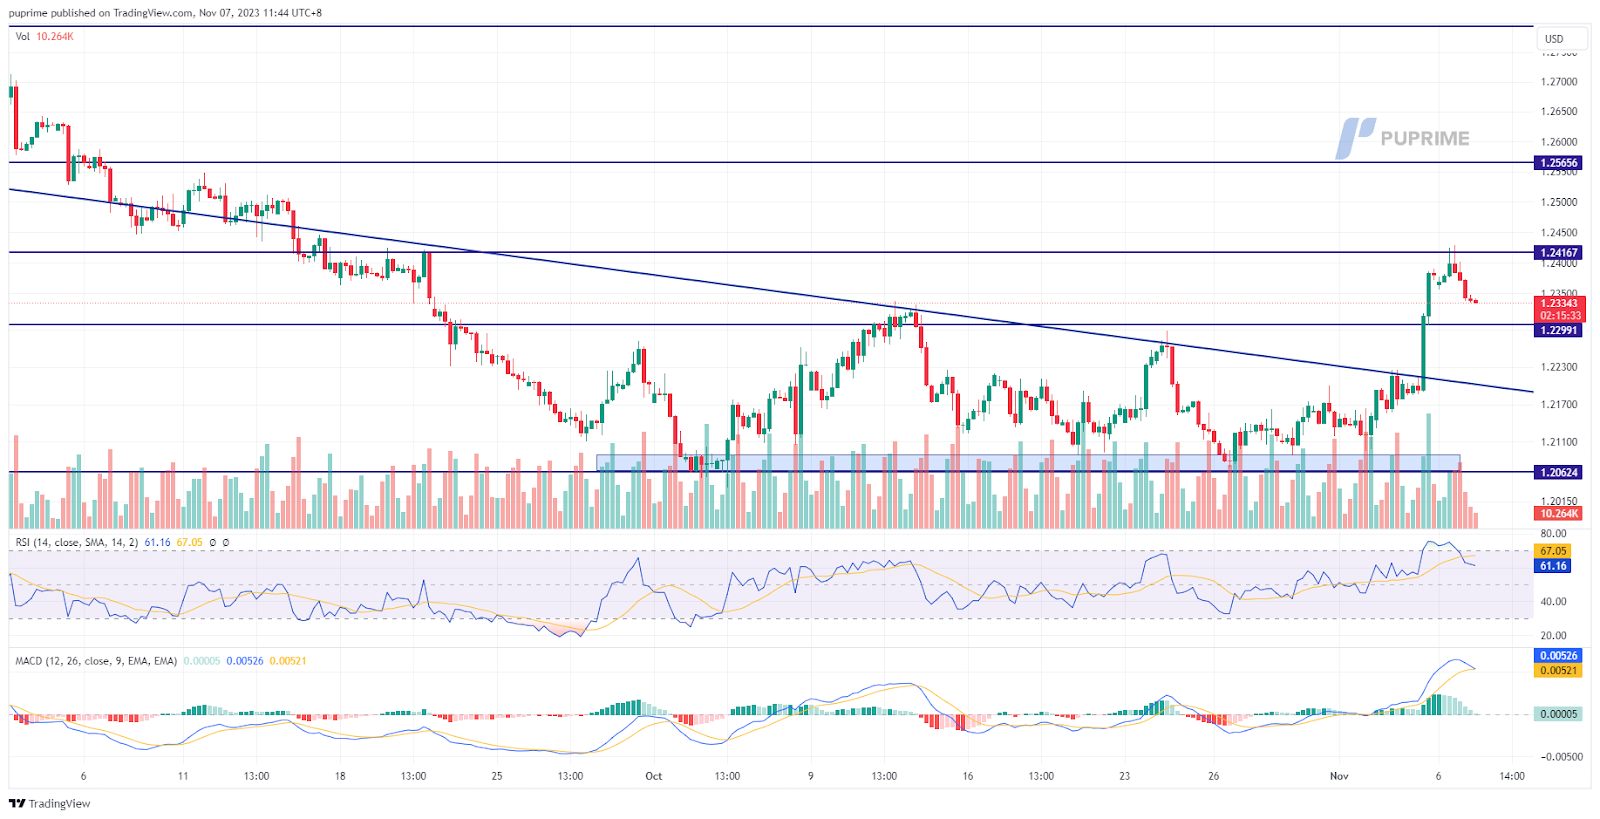
The British Pound was under pressure, suppressed beneath a formidable resistance level at 1.2420, leading to a technical retracement. The dollar’s resurgence was propelled by hawkish comments from Federal Reserve officials, emphasising that the fight against inflation remains ongoing. Market focus now shifts to Jerome Powell’s speech on Thursday, eagerly anticipating insights into the Fed’s monetary outlook. Additionally, the upcoming release of the UK’s GDP data on Friday is poised to inject significant volatility into the Pound-Dollar pair, adding to the intricacies of the currency market.
The Cable retraced at a strong resistance level at 1.2420 but is still trading above 38.2% of the Fibonacci retracement level, suggesting the bullish trend is still intact. The RSI is on the brink of exiting from the overbought zone while the MACD has crossed, suggesting the bullish momentum is diminishing.
Resistance level: 1.2420, 1.2570
Support level: 1.2300, 1.2060
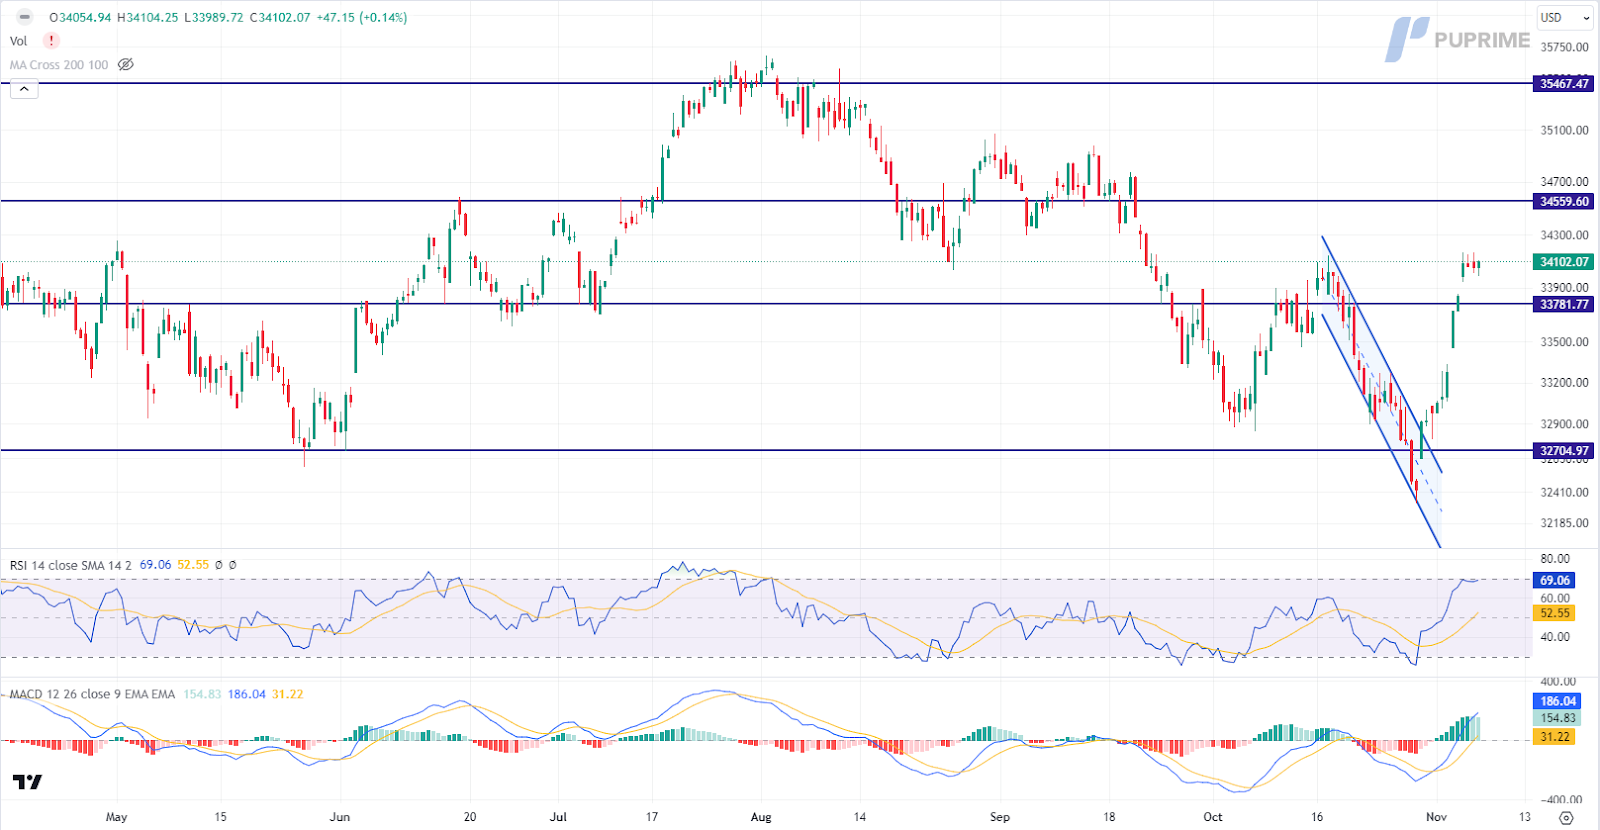
The US equity market remains on an upward trajectory, bolstered by declining US Treasury yields. Market sentiment suggests an anticipated shift in the Federal Reserve’s policy from tightening to expansion, given signs of a slowdown in the US economic recovery. Notably, positive earnings reports from major US corporations contribute to this positive market outlook.
The Dow is trading higher following the prior breakout above the resistance level. MACD has illustrated diminishing bullish momentum, while RSI is at 69, suggesting the index might enter overbought territory.
Resistance level: 34560.00, 35465.00
Support level: 33780.00, 32705.00
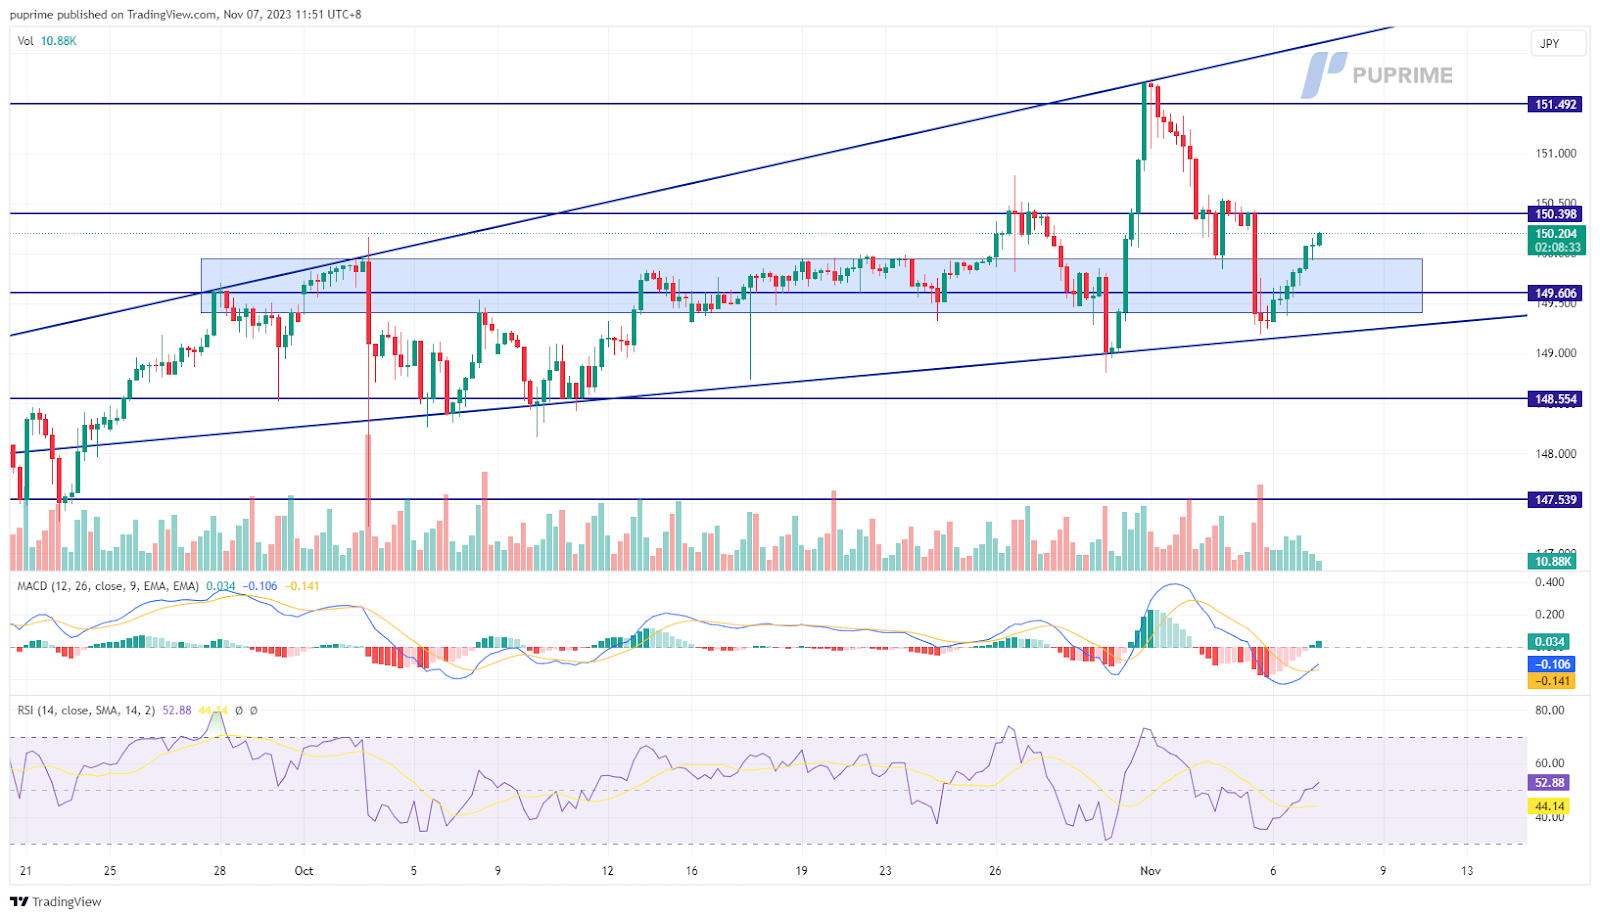
The USD/JPY pair faced a slowdown as the dollar gained momentum, bolstered by hawkish remarks from Fed officials, indicating the Fed’s ongoing commitment to combat inflation. Meanwhile, the Japanese Yen grappled with headwinds stemming from the Bank of Japan’s dovish stance, as highlighted in the BoJ meeting minutes. Market participants must exercise patience, anticipating potential shifts in the BoJ’s monetary policy, which are not expected until the arrival of spring next year.
USD/JPY rebounded from above its uptrend support level at 149.30 and was once again traded back to the liquidity zone and gave a neutral signal for the pair. The MACD has crossed at below zero line and the RSI has rebounded before getting into the oversold zone suggesting the bearish momentum has vanished.
Resistance level: 150.40, 151.55
Support level: 148.55, 144.54
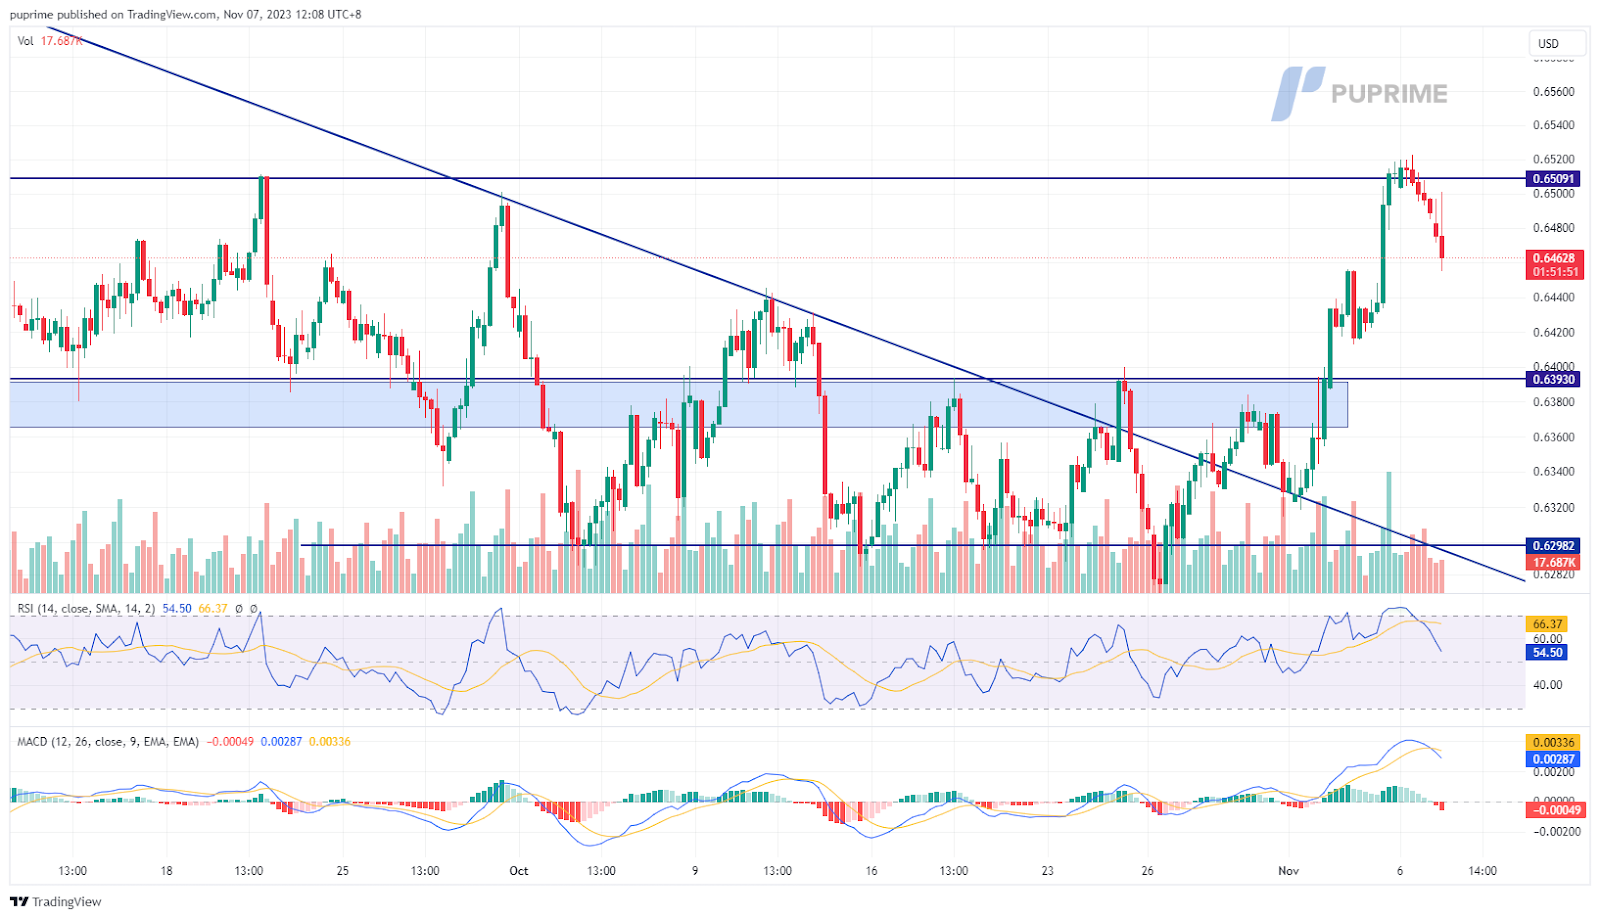
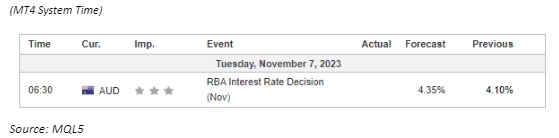
The AUD/USD pair retraced as the U.S. dollar regained its bullish momentum. The RBA’s decision to raise interest rates by 25 basis points, aligning with market expectations, elevated rates to their highest level in 12 years. While this move was anticipated, its full impact is yet to be fully assessed. Investors are closely monitoring the repercussions of the RBA’s latest interest rate hike, considering how these developments might influence the currency pair’s future trajectory.
The AUD/USD retraced sharply at its strong resistance level of 0.6510 but is still above its short-term Fibonacci retracement level of 61.8% as of writing. The RSI has declined from the overbought zone while the MACD has crossed, suggesting the bullish momentum has waned.
Resistance level: 0.6510, 0.6620
Support level: 0.6400, 0.6300
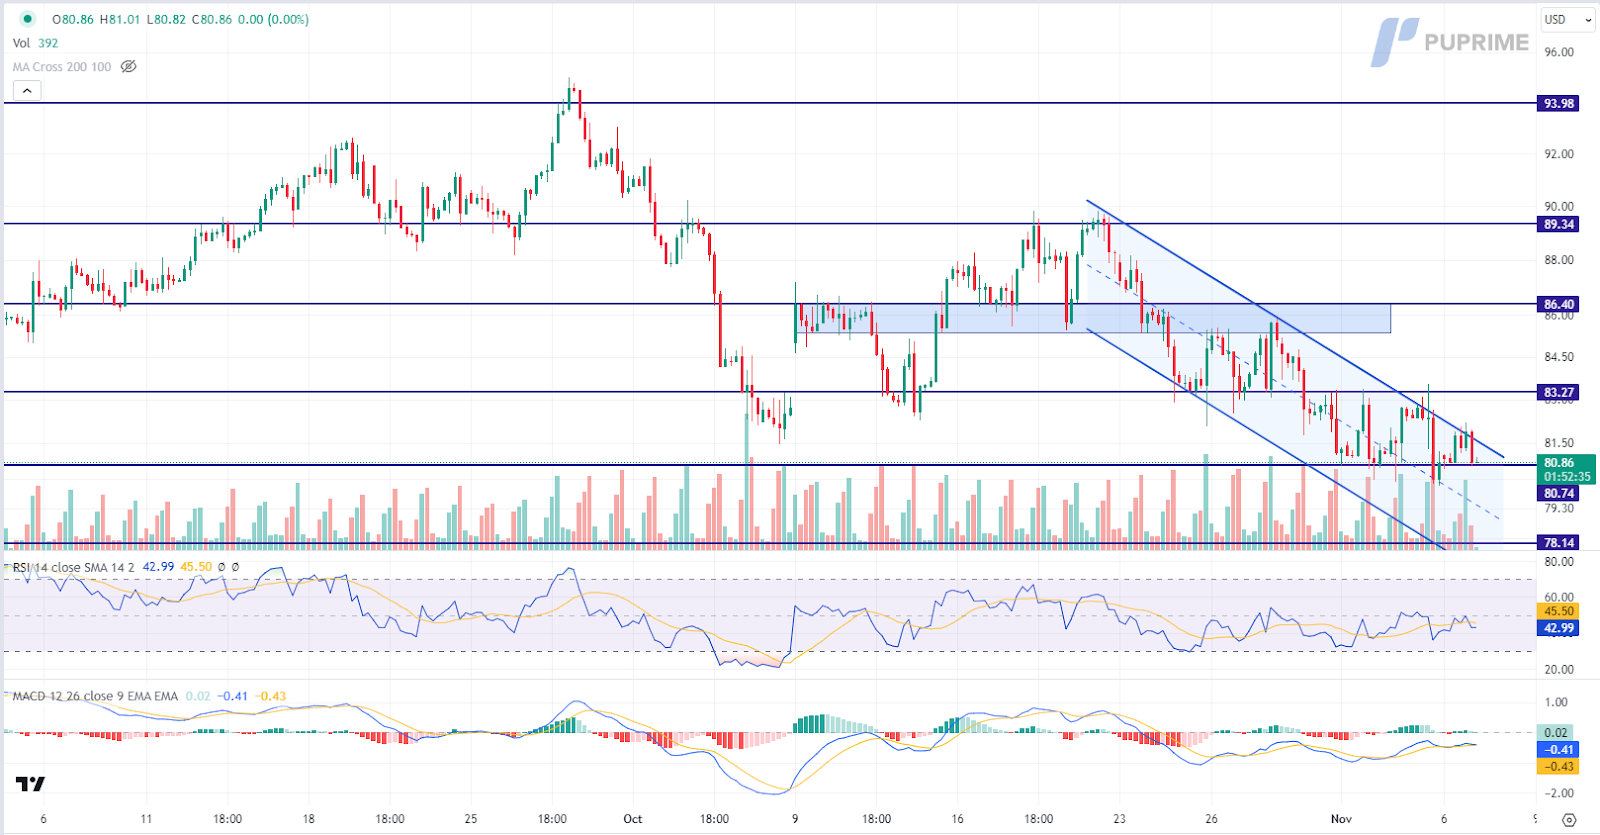
Concerns about potential oil supply disruptions have eased following US Secretary of State Antony Blinken’s claims of progress in the efforts to de-escalate the Israel-Hamas conflict. Despite persisting challenges, the crude oil market remains consolidated around the support area, supported by major suppliers’ decisions to tighten oil supply. Reuters reports confirm that major suppliers, including Saudi Arabia and Russia, intend to sustain ongoing supply reductions until year-end, indicating a tightening oil market in the near term.
Oil prices are trading lower while currently testing the support level. MACD has illustrated diminishing bullish momentum, while RSI is at 43, suggesting the commodity might extend its losses after breakout since the RSI stays below the midline.
Resistance level: 83.25, 86.40
Support level: 80.75, 78.15

Trade with simulated capital and earn real profits after you pass our trader assessment.

12 December 2023, 05:38 All Eyes On U.S. CPI Reading

11 December 2023, 05:23 Dollar Surges On Exceptional Jobs Data

8 December 2023, 05:50 Yen Rallies On BoJ Hawkish Comment


التسجيلات الجديدة غير متاحة
نحن لا نقبل تسجيلات جديدة في الوقت الحالي.
بينما التسجيلات الجديدة غير متاحة، يمكن للمستخدمين الحاليين مواصلة تحدياتهم وأنشطة التداول كالمعتاد.
Disclaimer: This website exclusively provides proprietary trading services. We do not engage in any regulated activities, offer investment management services, or manage funds on behalf of external clients. Our trading activities are conducted solely with the firm's own capital, and we do not accept client deposits or manage client accounts. It's important to note that none of the services we provide should be construed as investment or financial services in accordance with applicable laws.
This website offers services related to professional skill and experience assessment, which determine your eligibility to trade with the firm's capital. The outcome of these services is inherently determined by your individual skill level and ability to perform within the trading requirements and objectives outlined for each service separately. Clients are strongly advised to thoroughly understand the requirements of the services before signing up for any.
The content provided on this website is for informational purposes only and does not constitute financial, investment, or trading advice. The information presented is based on sources believed to be reliable, but we do not guarantee its accuracy, completeness, or timeliness. We disclaim any liability for any loss or damage arising directly or indirectly from the use of or reliance on the information provided on this website.
This website is not directed to residents of certain jurisdictions such as the United States, Singapore, Australia, China and some other specified regions, and is not intended for distribution to, or use by, any person in any countries or jurisdictions where such distribution or use would be contrary to local law or regulation.
This website is owned by Finzero Cap Ltd, a company incorporated in the Republic of Cyprus under registration number HE414308, with its registered office at 62 Athalassas, Mezzanine, Strovolos 2012, Nicosia, Cyprus. Finzero Cap Ltd serves as the authorized representative for PU Prime Ltd.