انضم إلى تحدي PU Xtrader اليوم
تداول برأس المال المحاكي واحصل على أرباح حقيقية بعد اجتياز برنامج تقييم المتداول الخاص بنا.
انضم إلى تحدي PU Xtrader اليوم
تداول برأس المال المحاكي واحصل على أرباح حقيقية بعد اجتياز برنامج تقييم المتداول الخاص بنا.
1 December 2023,05:41
Daily Market Analysis
1 December 2023, 05:41
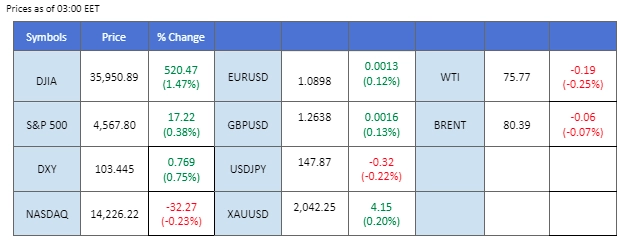
Despite OPEC+ announces production cuts, oil traders remained unconvinced, leading to a nearly 3% plunge in oil prices overnight. The efficacy of these cuts is questionable as they are implemented on a “voluntary” basis. Notably, Angola rejected the measure, expressing dissatisfaction with its allocated output quota. Simultaneously, the US dollar’s strength faces challenges, particularly following the release of US PCE data, which revealed signs of easing inflation. This diminishes the likelihood of further rate hikes by the Federal Reserve. In contrast, US equity markets experienced a robust performance in the best month of 2023. The Dow Jones, in particular, led the charts, reaching its highest level since January 2022.
Current rate hike bets on 13rd December Fed interest rate decision:
Source: CME Fedwatch Tool
0 bps (95.0%) VS 25 bps (5%)
The US Dollar stages a comeback as investors engage in bargain buying following inflation data that aligned expectations. Meanwhile, better-than-expected US Initial Jobless Claims further contribute to the Dollar’s resurgence, reflecting a solid labour market and boosting confidence in the greenback.
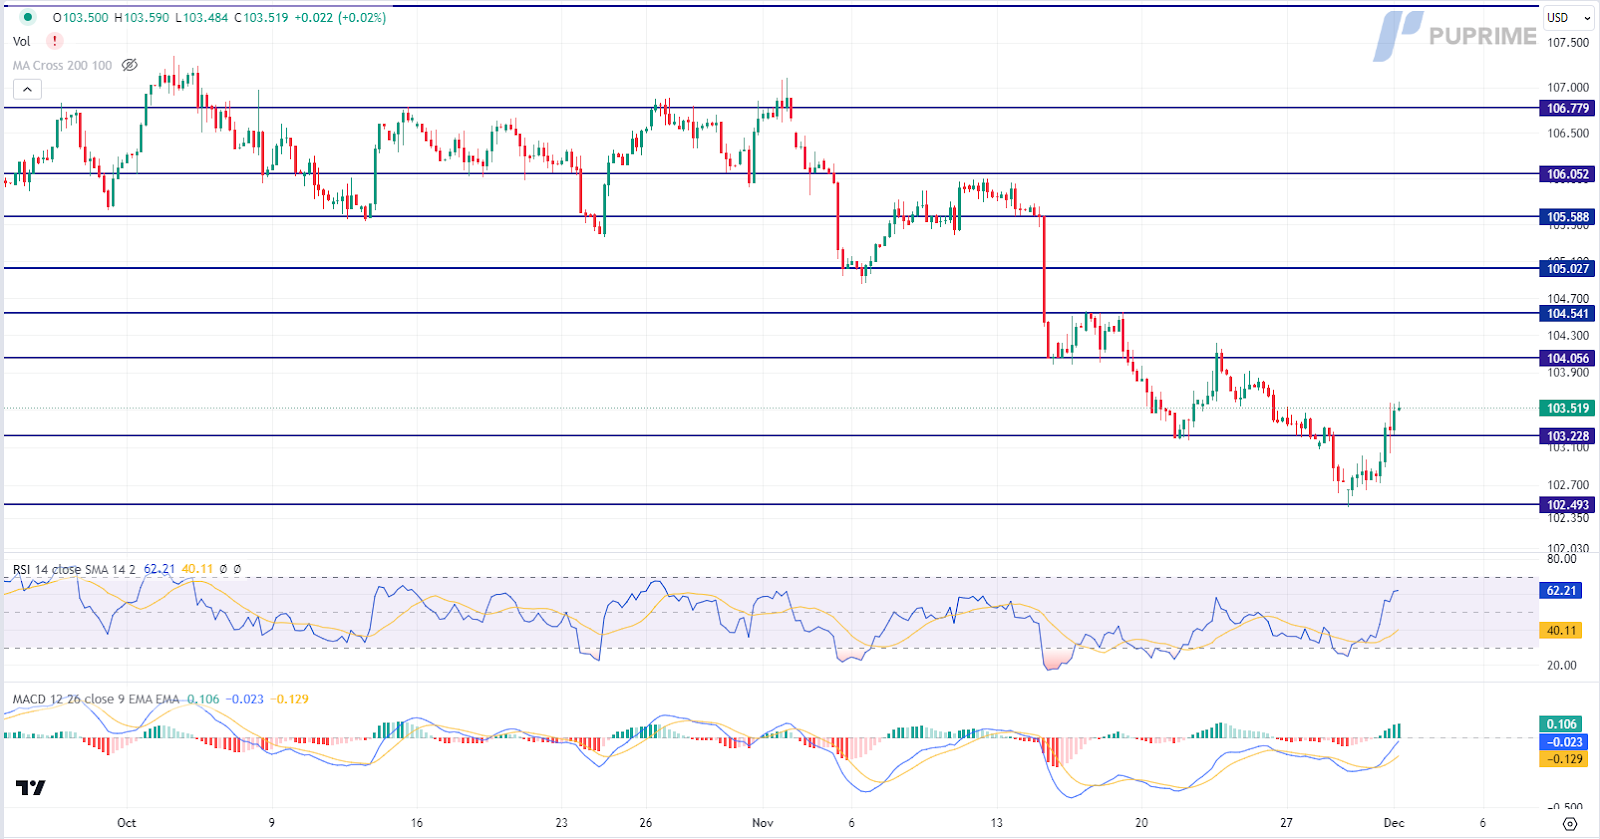
The Dollar Index is trading higher following the prior breakout above the resistance level. MACD has illustrated increasing bullish momentum, while RSI is at 62, suggesting the index might extend its gains since the RSI stays above the midline.
Resistance level: 104.05, 104.55
Support level: 103.25, 102.50
Gold prices experience a slight retreat from the critical resistance level of $2050 as profit-taking ensues and the rebound in the US Dollar exerts pressure on the dollar-denominated precious metal. Despite this short-term dip, the overall outlook for gold remains bullish, driven by the potential pause in the Federal Reserve’s tightening cycle, which could further support the precious metal.
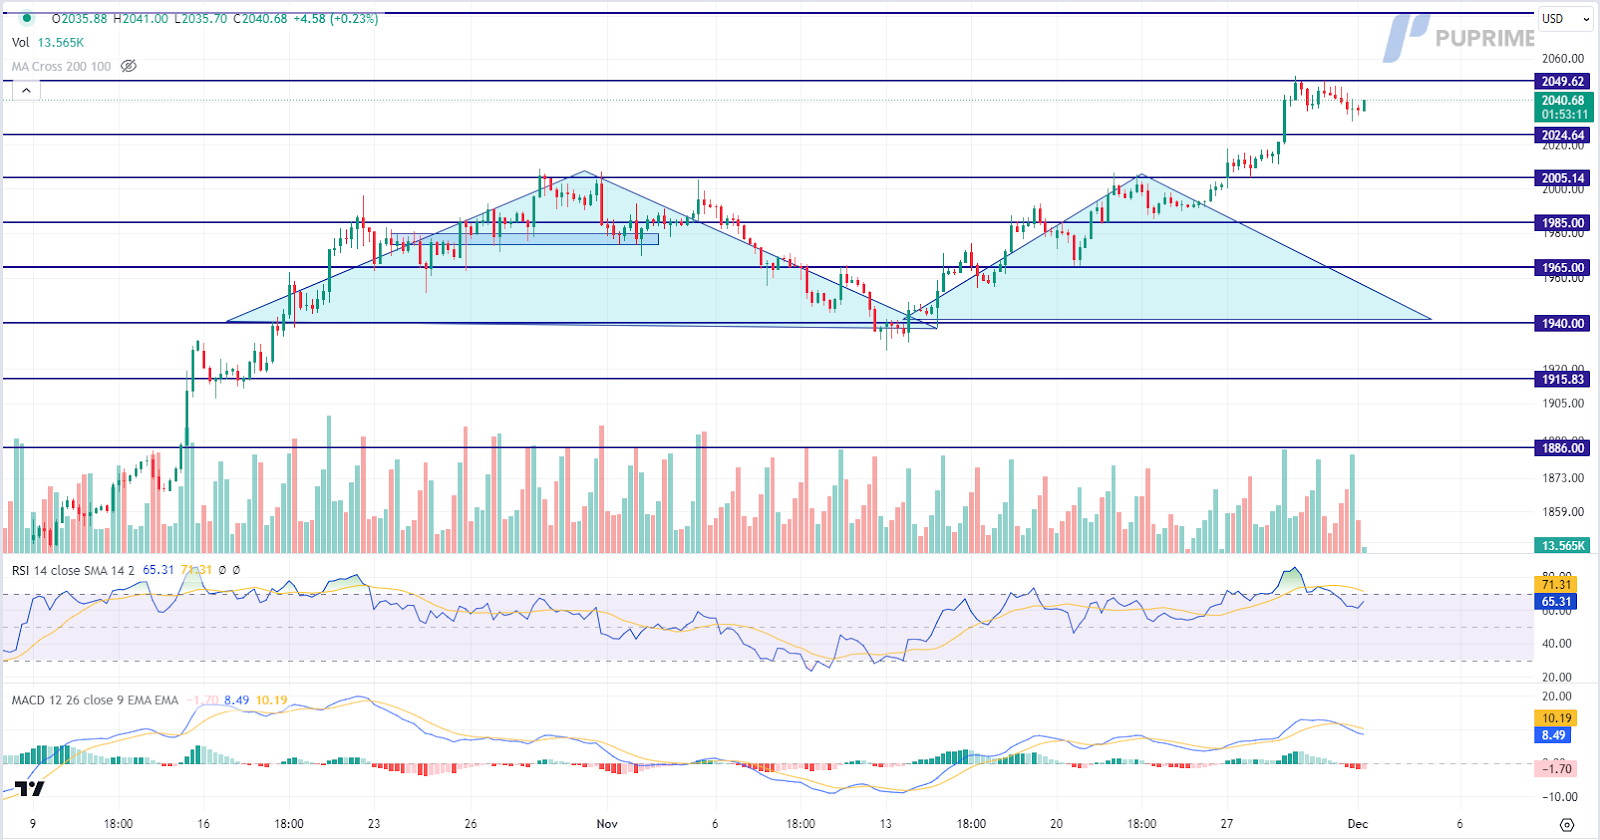
Gold prices are trading lower following the prior retracement from the resistance level. MACD has illustrated increasing bearish momentum, while RSI is at 65, suggesting the commodity might extend its losses since the RSI retreated from overbought territory.
Resistance level: 2050.00, 2080.00
Support level: 2025.00, 2005.00
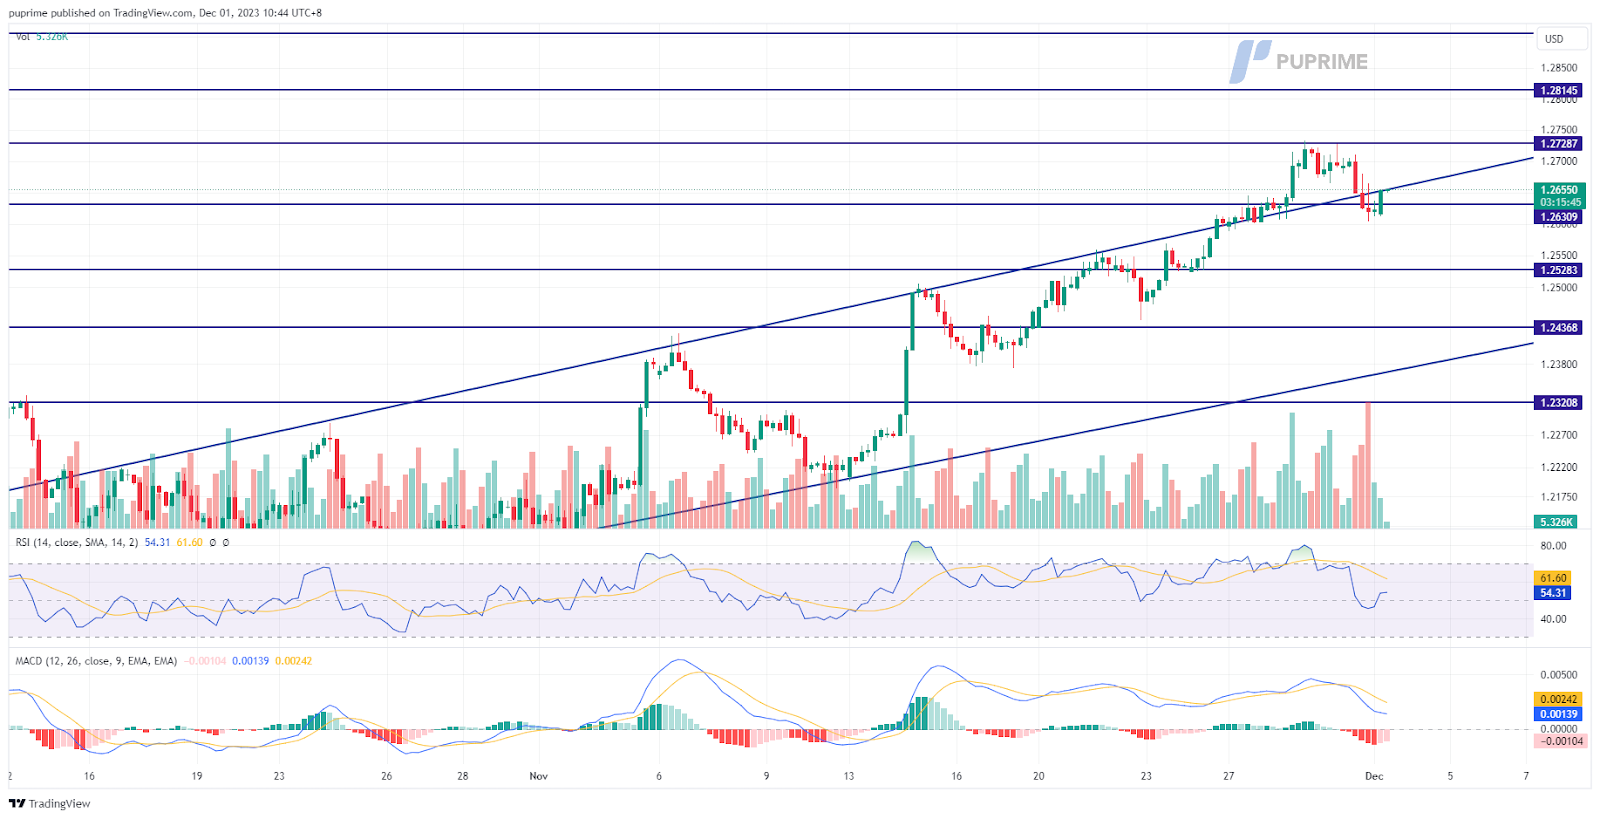
The Cable secured support following a brief technical retracement, positioned above the uptrend resistance level. The U.S. dollar exhibited a decline subsequent to the release of the U.S. PCE, aligning with market expectations and indicating a moderation in U.S. inflation. This economic data has persuaded the market that the probability of additional rate hikes by the Federal Reserve has diminished.
The Cable found support after a technical retracement and is still trading at an elevated level, suggesting the bullish bias remained. The RSI declined from the overbought zone while the MACD fell toward the zero line, suggesting the bullish momentum has eased drastically.
Resistance level: 1.2729 1.2815
Support level: 1.2630, 1.2528
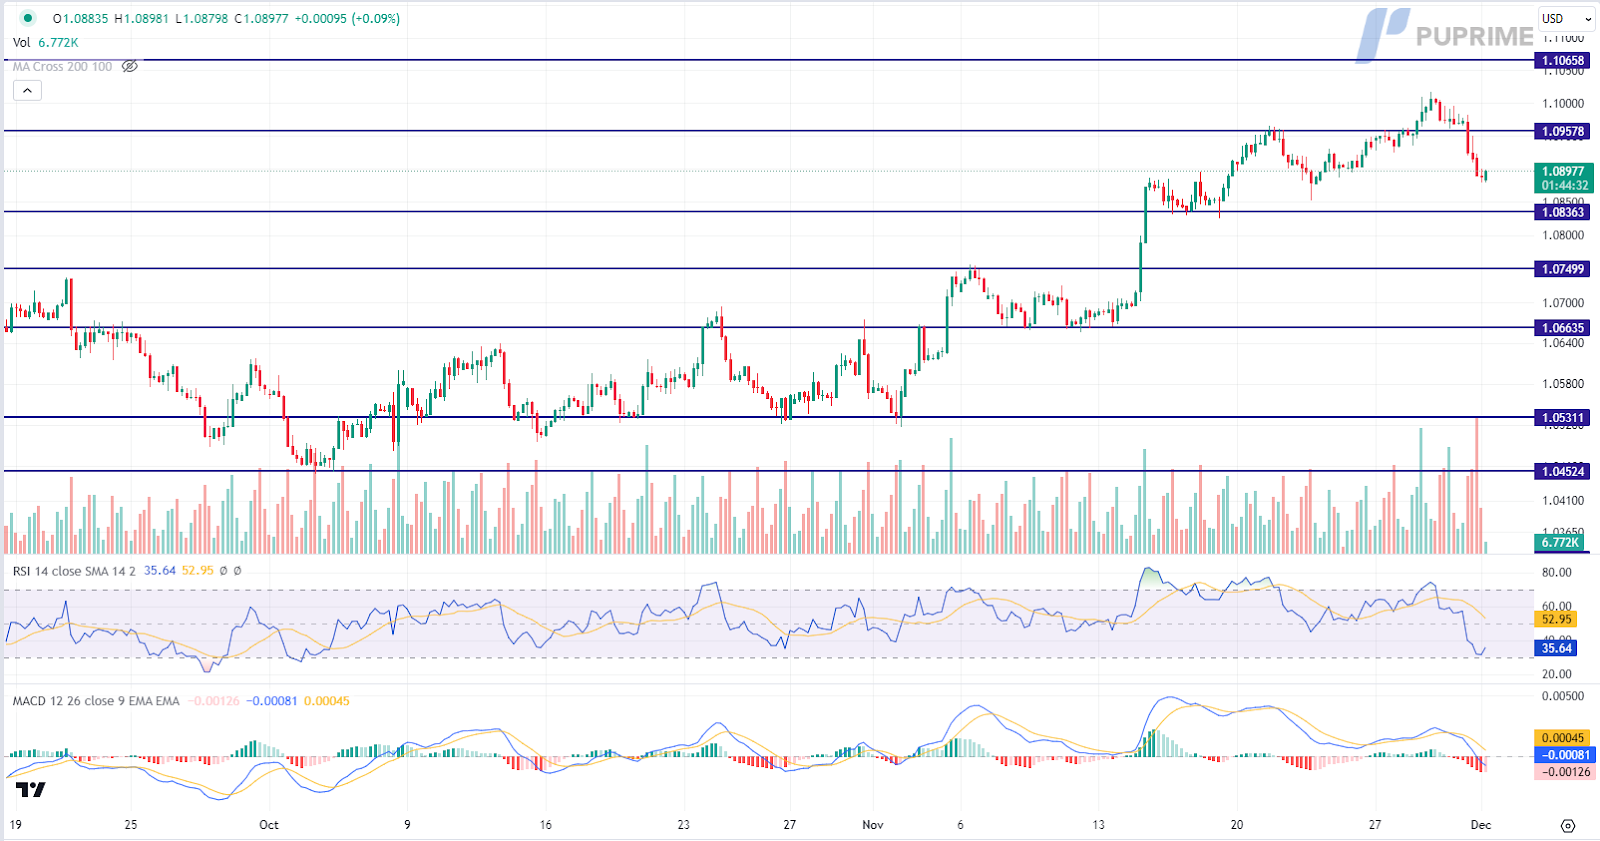
The Euro faces downward pressure as Eurostat data reveals a slowdown in the eurozone’s inflation rate to 2.40% on a yearly basis in November 2023. This figure is down from 2.90% in October and falls below market expectations of 2.70%. The decline in inflation renews focus on the European Central Bank’s 2% target, hinting at a potential shift in monetary policy.
EUR/USD is trading lower following the prior retracement from the resistance level. However, MACD has illustrated diminishing bearish momentum, while RSI is at 36, suggesting the pair might enter oversold territory.
Resistance level: 1.0960, 1.1065
Support level: 1.0835, 1.0750
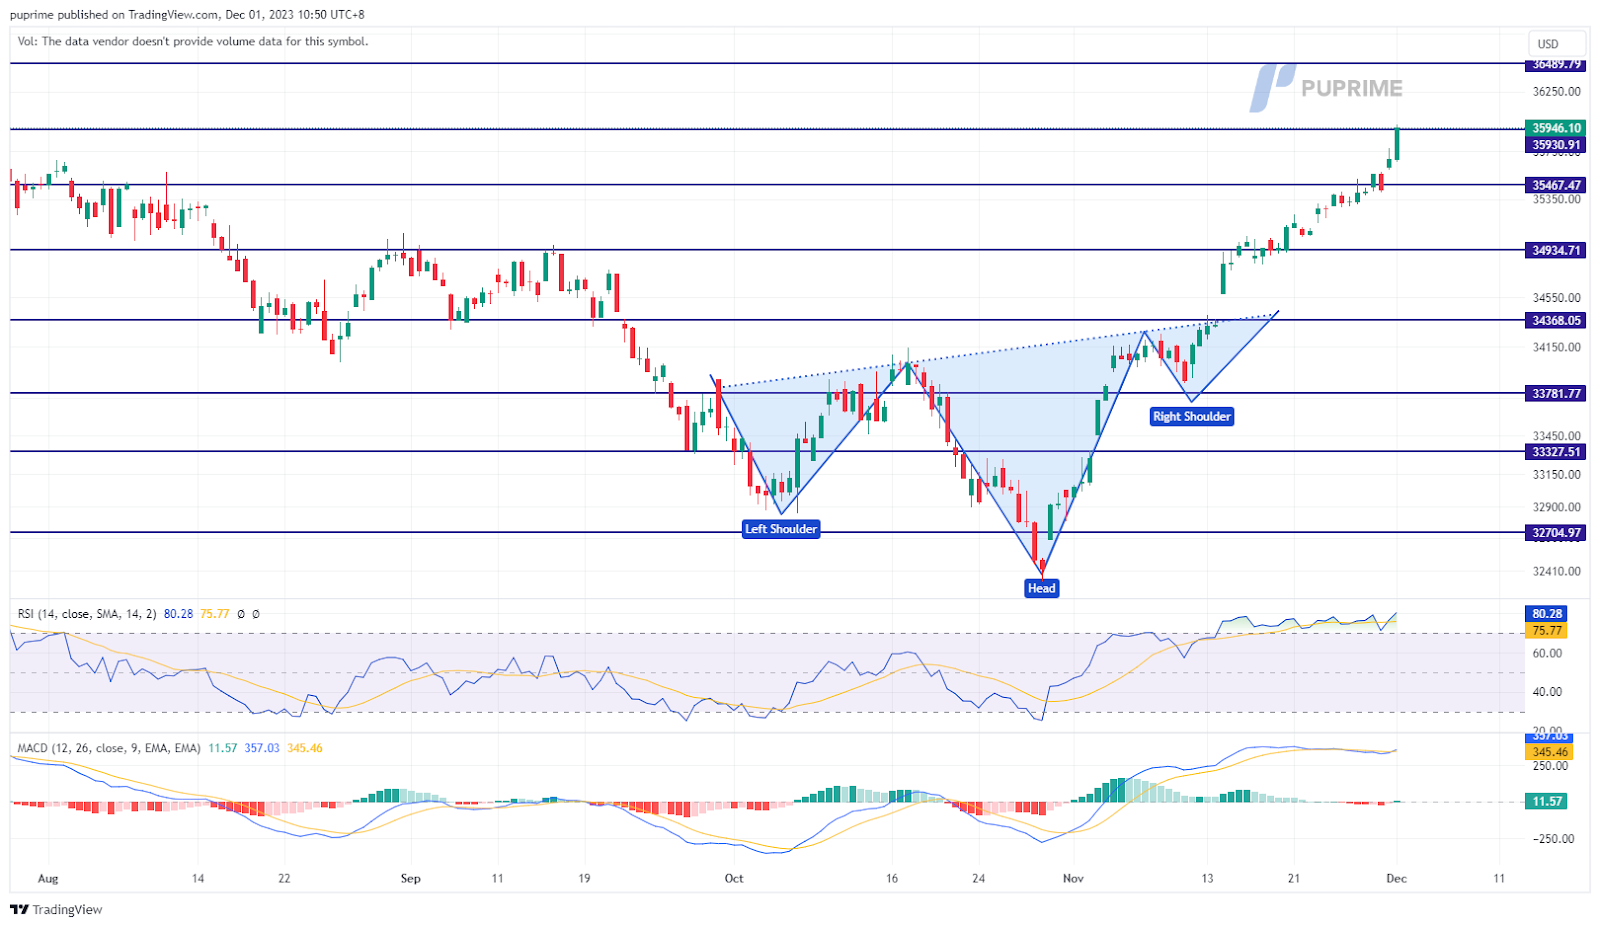
Last night, US equity markets surged by 520 points, reaching their highest level since January 2022. The impetus behind this notable upswing was primarily the PCE data, indicating a cooling trend in U.S. inflation. Additionally, key components, such as Salesforce, exceeded easing expectations, further contributing to the overall strength of the index. Marking its best month in 2023, the index anticipates continued bullish momentum into December.
The Dow is currently trading with an extremely bullish momentum, suggesting the bullish bias continues. The RSI has been flowing in the overbought zone for nearly a week while the MACD continue to flow at an elevated level, suggesting the bullish momentum remains strong.
Resistance level: 35465.00, 35930.00
Support level: 34935.00, 34370.00
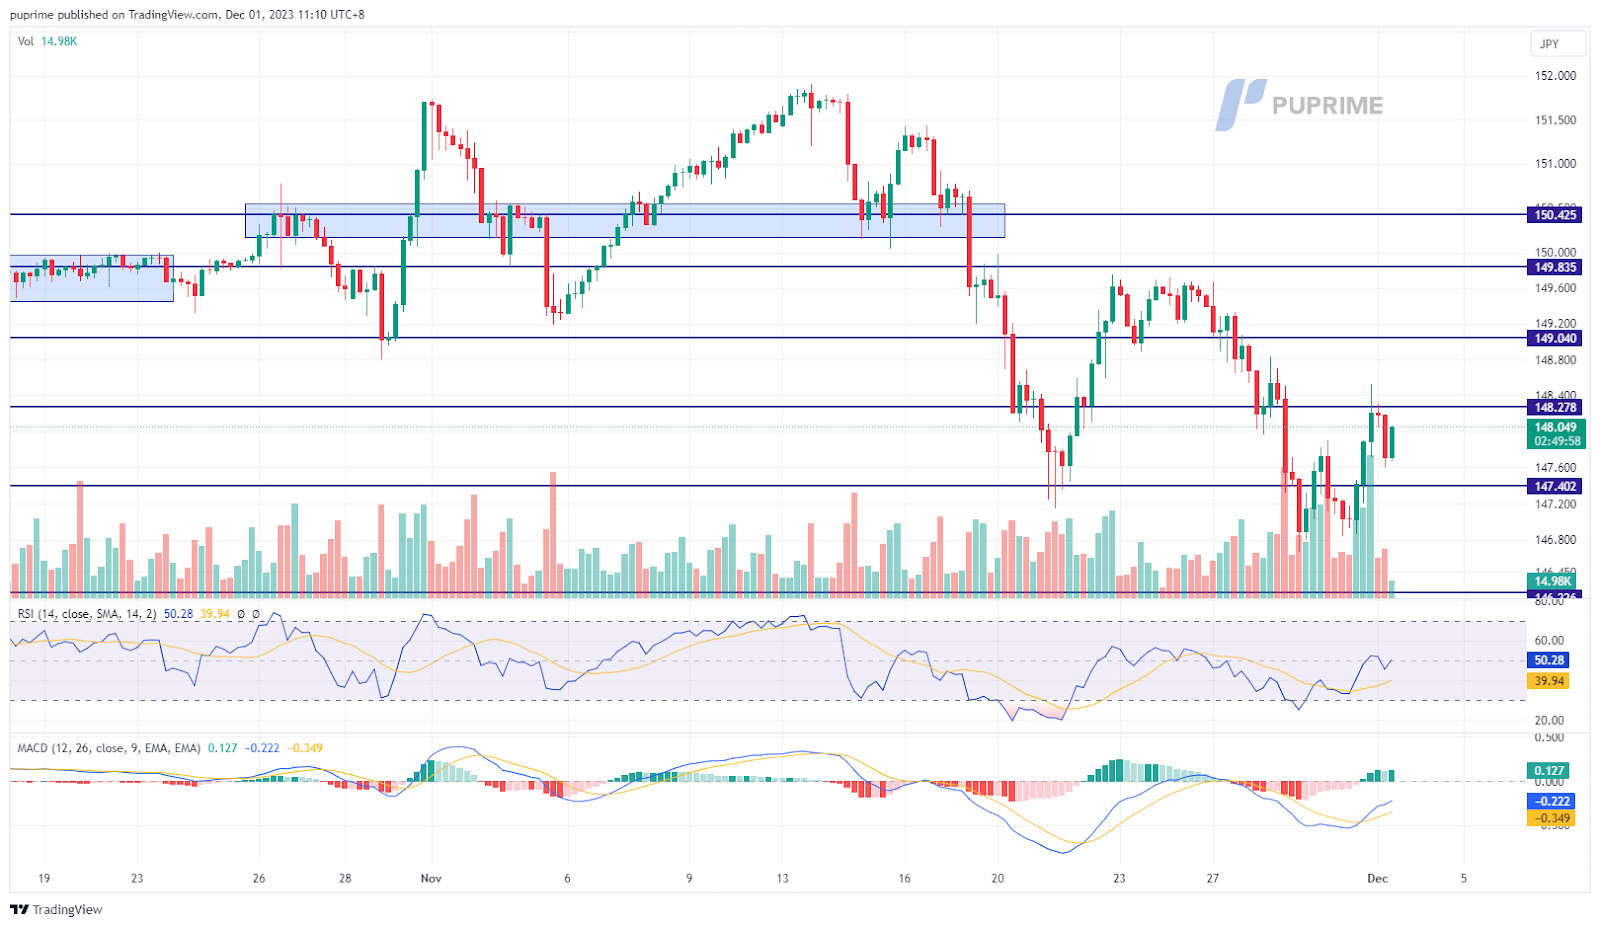
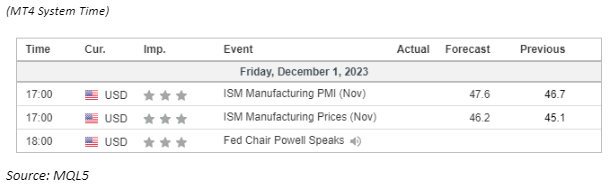
The USD/JPY pair experienced a fluctuating price movement, exhibiting a seesaw pattern following a three-session decline at the beginning of the week. The Japanese Yen maintained its strength, supported by a sustainable inflation rate in Japan. Conversely, the U.S. dollar faced hindrance due to the downbeat PCE data revealed last night. All attention is directed towards Jerome Powell, the Fed’s chair, who is scheduled to speak later today. Market participants eagerly await his insights on the inflation issue and potential monetary policy moves from the Federal Reserve.
The USD/JPY rebounded after it slid for 3 straight sessions. The RSI has also broken above from the oversold zone while the MACD is climbing toward the zero line from below, suggesting the bearish momentum has eased drastically.
Resistance level: 148.30, 149.05
, Support level: 147.40, 146.20
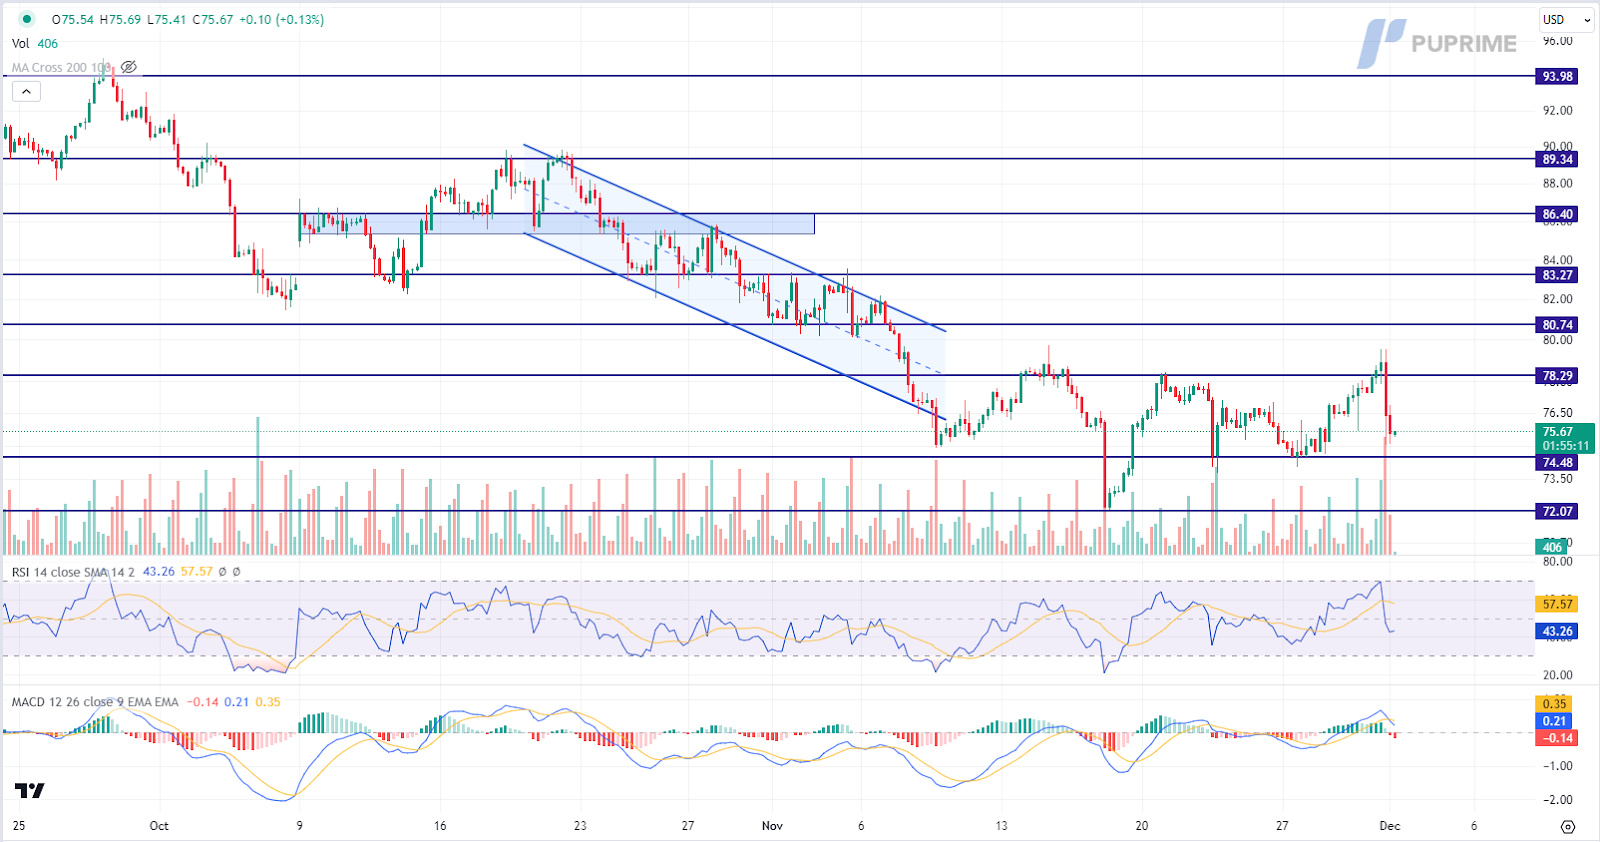
Oil prices decline despite OPEC+ announcing an unexpected cut of about 900,000 barrels per day. Concerns about a stagnant global economy and perceptions that the supply cuts may fall short of boosting prices weigh on market sentiment. In addition, lack of consensus among OPEC+ nations and the view that the cuts are largely voluntary contribute to heightened uncertainties, exerting downward pressure on oil prices.
Oil prices are trading lower following the prior retracement from the resistance level. MACD has illustrated increasing bearish momentum, while RSI is at 43, suggesting the commodity might extend its losses since the RSI stays below the midline.
Resistance level: 78.30, 80.75
Support level: 74.50, 72.05

Trade with simulated capital and earn real profits after you pass our trader assessment.

12 December 2023, 05:38 All Eyes On U.S. CPI Reading

11 December 2023, 05:23 Dollar Surges On Exceptional Jobs Data

8 December 2023, 05:50 Yen Rallies On BoJ Hawkish Comment


التسجيلات الجديدة غير متاحة
نحن لا نقبل تسجيلات جديدة في الوقت الحالي.
بينما التسجيلات الجديدة غير متاحة، يمكن للمستخدمين الحاليين مواصلة تحدياتهم وأنشطة التداول كالمعتاد.
Disclaimer: This website exclusively provides proprietary trading services. We do not engage in any regulated activities, offer investment management services, or manage funds on behalf of external clients. Our trading activities are conducted solely with the firm's own capital, and we do not accept client deposits or manage client accounts. It's important to note that none of the services we provide should be construed as investment or financial services in accordance with applicable laws.
This website offers services related to professional skill and experience assessment, which determine your eligibility to trade with the firm's capital. The outcome of these services is inherently determined by your individual skill level and ability to perform within the trading requirements and objectives outlined for each service separately. Clients are strongly advised to thoroughly understand the requirements of the services before signing up for any.
The content provided on this website is for informational purposes only and does not constitute financial, investment, or trading advice. The information presented is based on sources believed to be reliable, but we do not guarantee its accuracy, completeness, or timeliness. We disclaim any liability for any loss or damage arising directly or indirectly from the use of or reliance on the information provided on this website.
This website is not directed to residents of certain jurisdictions such as the United States, Singapore, Australia, China and some other specified regions, and is not intended for distribution to, or use by, any person in any countries or jurisdictions where such distribution or use would be contrary to local law or regulation.
This website is owned by Finzero Cap Ltd, a company incorporated in the Republic of Cyprus under registration number HE414308, with its registered office at 62 Athalassas, Mezzanine, Strovolos 2012, Nicosia, Cyprus. Finzero Cap Ltd serves as the authorized representative for PU Prime Ltd.